正在加载图片...
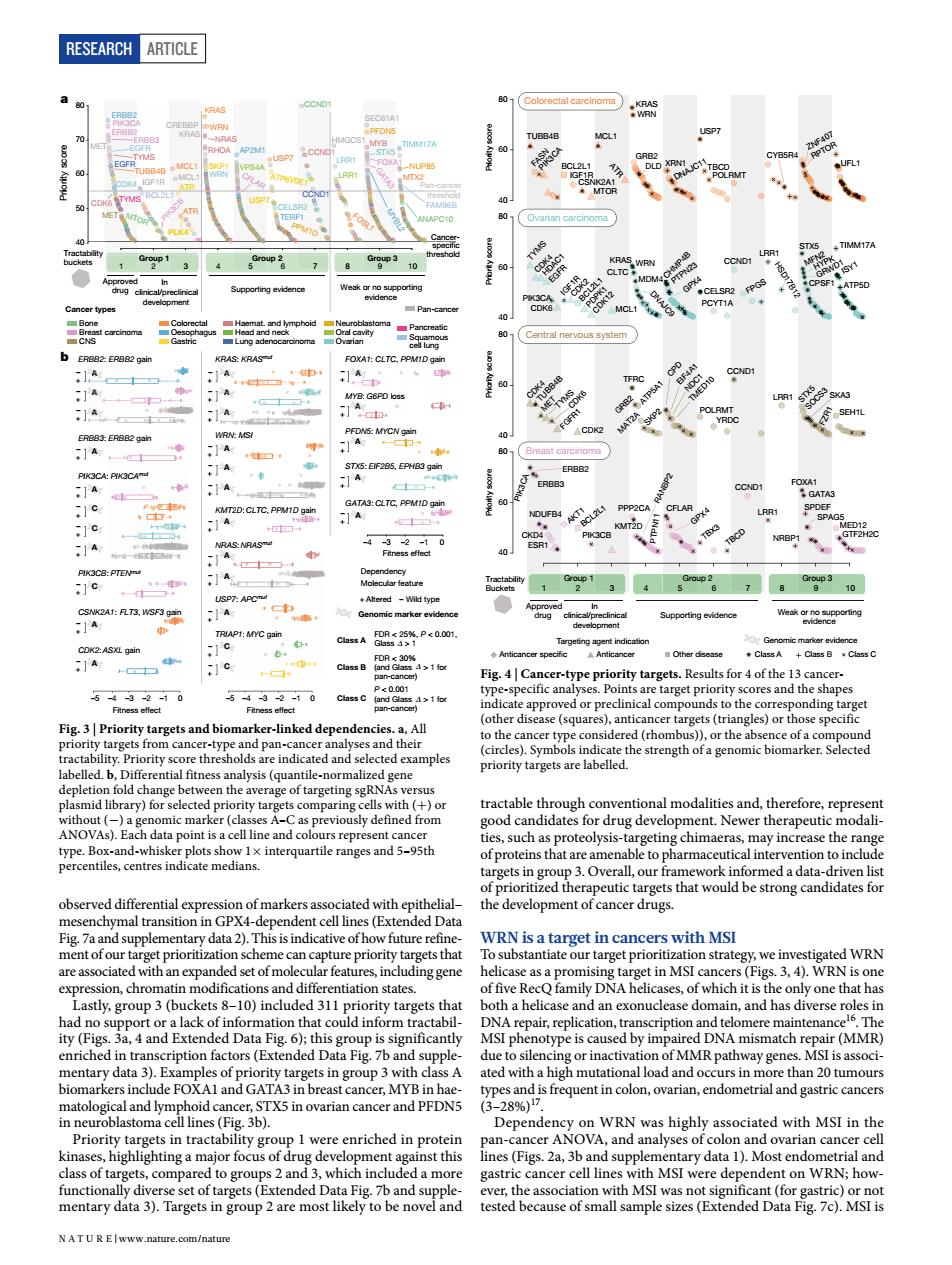
RESEARCH ARTICLE 长餐 1A 11 1A -1c -1G 41 cal co ker-nke dependences All targets( d examples aliz targeting sgRNAs versu 9 trac VA) geting chimae may inerease the of po h2aCrargtharwouldbestomgcandidasoi P-dependent cellines (Ex with MSI on sch ytargets that ntiation states. ng gene group( ed by imp DNA mismatch res (MMR id cano TX5 in ovarian cancer and PEDNS roun i were entiched in protein nst this and ted he ass .com/naturRESEARCH Article observed differential expression of markers associated with epithelial– mesenchymal transition in GPX4-dependent cell lines (Extended Data Fig. 7a and supplementary data 2). This is indicative of how future refinement of our target prioritization scheme can capture priority targets that are associated with an expanded set of molecular features, including gene expression, chromatin modifications and differentiation states. Lastly, group 3 (buckets 8–10) included 311 priority targets that had no support or a lack of information that could inform tractability (Figs. 3a, 4 and Extended Data Fig. 6); this group is significantly enriched in transcription factors (Extended Data Fig. 7b and supplementary data 3). Examples of priority targets in group 3 with class A biomarkers include FOXA1 and GATA3 in breast cancer, MYB in haematological and lymphoid cancer, STX5 in ovarian cancer and PFDN5 in neuroblastoma cell lines (Fig. 3b). Priority targets in tractability group 1 were enriched in protein kinases, highlighting a major focus of drug development against this class of targets, compared to groups 2 and 3, which included a more functionally diverse set of targets (Extended Data Fig. 7b and supplementary data 3). Targets in group 2 are most likely to be novel and tractable through conventional modalities and, therefore, represent good candidates for drug development. Newer therapeutic modalities, such as proteolysis-targeting chimaeras, may increase the range of proteins that are amenable to pharmaceutical intervention to include targets in group 3. Overall, our framework informed a data-driven list of prioritized therapeutic targets that would be strong candidates for the development of cancer drugs. WRN is a target in cancers with MSI To substantiate our target prioritization strategy, we investigated WRN helicase as a promising target in MSI cancers (Figs. 3, 4). WRN is one of five RecQ family DNA helicases, of which it is the only one that has both a helicase and an exonuclease domain, and has diverse roles in DNA repair, replication, transcription and telomere maintenance16. The MSI phenotype is caused by impaired DNA mismatch repair (MMR) due to silencing or inactivation of MMR pathway genes. MSI is associated with a high mutational load and occurs in more than 20 tumours types and is frequent in colon, ovarian, endometrial and gastric cancers (3–28%)17. Dependency on WRN was highly associated with MSI in the pan-cancer ANOVA, and analyses of colon and ovarian cancer cell lines (Figs. 2a, 3b and supplementary data 1). Most endometrial and gastric cancer cell lines with MSI were dependent on WRN; however, the association with MSI was not significant (for gastric) or not tested because of small sample sizes (Extended Data Fig. 7c). MSI is A A A 40 50 60 70 80 –5 –4 –2 –1 0 ERBB2: ERBB2 gain –5 –4 –3 –2 –1 0 –4 –3 –2 –1 0 Tractability buckets Approved drug In clinical/preclinical development Supporting evidence Weak or no supporting evidence Priority score Pan-cancer threshold Cancerspeci c threshold a Dependency Molecular feature ERBB3: ERBB2 gain PIK3CA: PIK3CAmut PIK3CB: PTENmut CSNK2A1: FLT3, WSF3 gain CDK2: ASXL gain KRAS: KRASmut WRN: MSI KMT2D: CLTC, PPM1D gain NRAS: NRASmut USP7: APCmut TRIAP1: MYC gain FOXA1: CLTC, PPM1D gain MYB: G6PD loss PFDN5: MYCN gain STX5: EIF2B5, EPHB3 gain GATA3: CLTC, PPM1D gain A A A A A A A A A A A A A A C C C A C C A A A – + – + – + – + – + – + – + – + – + – + – + Fitness effect Fitness effect Fitness effect FDR < 25%, P < 0.001, Glass > 1 FDR < 30% (and Glass > 1 for pan-cancer) P < 0.001 (and Glass > 1 for pan-cancer) Class A Class B Class C Genomic marker evidence Bone Cancer types Breast carcinoma CNS Colorectal Oesophagus Gastric Neuroblastoma Ovarian Haemat. and lymphoid Head and neck Lung adenocarcinoma Oral cavity Pancreatic Squamous cell lung b ERBB2 ERBB2ERBB3 PIK3CA PIK3CB KRAS KRAS WRN Pa ERBB2 ERBB2 ERBB3 PIK3CA PIK3CB KRAS KRAS WRN WRN NRAS USP7 USP7 FOXA1 MYB PFDN5 STX5 GATA3 MET EGFR TYMS EGFRTUBB4B CDK4 CDK6 TYMS MET IGF1R BCL2L1 MTOR MCL1 MCL1 ATR ATR PLK4 CREBBP RHOA SKP1 AP2M1 VPS4A CFLAR ATP6V0E1 CELSR2 TERF1 CCND1 CCND1 CCND1 PPM1D HMGCS1 LRR1 LRR1 FOSL1 SEC61A1 MYBL2 TIMM17A NUP85 MTX2 FAM96B ANAPC10 t 12345678 9 10 Group 1 Group 2 Group 3 Pan-cancer A A A FLT3, WSF3 gain XL gain PIK3CAmut P7: APCmut AP1: MYC gain D: CLTC, PPM1D gain A A A A A 2B5, EPHB3 gain LTC, PPM1D gain A MYB: G6PD loss A –3 – + – + – + – + – + – + – + – + – + – + – + – + – + – + – + – + – + + Altered – Wild type Δ Δ Δ Fig. 3 | Priority targets and biomarker-linked dependencies. a, All priority targets from cancer-type and pan-cancer analyses and their tractability. Priority score thresholds are indicated and selected examples labelled. b, Differential fitness analysis (quantile-normalized gene depletion fold change between the average of targeting sgRNAs versus plasmid library) for selected priority targets comparing cells with (+) or without (−) a genomic marker (classes A–C as previously defined from ANOVAs). Each data point is a cell line and colours represent cancer type. Box-and-whisker plots show 1× interquartile ranges and 5–95th percentiles, centres indicate medians. 123456789 10 Group 1 Group 2 Group 3 Approved drug Supporting evidence Weak or no supporting evidence 40 60 80 40 60 80 40 60 80 40 60 80 CDK4 TUBB4B MET TYMS CDK6 FGFR1 CDK2 TFRC GRB2 ATP5A1 MAT2A SKP2 CPD EIF4A1 NDC1 TMED10 POLRMT YRDC CCND1 LRR1 STX5 SOCS3SKA3 SEH1L TYMS HDAC1 CDK4 EGFR PIK3CA CDK6 IGF1R CDK2 BCL2L1 PDPK1 CDK12 MCL1 KRAS WRN CLTC MDM4 DNAJC9 CHMP4B CELSR2 PCYT1A CCND1 FPGS LRR1HSD17B12 STX5 MFN2 HYPK GRWD1 CPSF1 TIMM17A ISY1 ATP5D TUBB4B FASN PIK3CA BCL2L1 IGF1R CSNK2A1 MTOR MCL1 ATR KRAS WRN GRB2 DLD XRN1 DNAJC11 USP7 TBCD POLRMT CYB5R4 ZNF407 RPTOR UFL1 PIK3CA ERBB2 ERBB3 GPX4 PTPN23 GPX NDUFB4 4 CKD4 ESR1 AKT1 BCL2L1 PIK3CB PPP2CA KMT2D RANBP2 CFLAR TBX3 TBCD CCND1 LRR1 NRBP1 FOXA1 GATA3 SPAG5 SPDEF MED12 GTF2H2C Priority score Priority score Priority score Priority score Anticancer speci c Anticancer Other disease Targeting agent indication PTP N11 FZR1 Class A Class C Genomic marker evidence Class B Colorectal carcinoma Ovarian carcinoma Central nervous system Breast carcinoma In clinical/preclinical development Tractability Buckets Fig. 4 | Cancer-type priority targets. Results for 4 of the 13 cancertype-specific analyses. Points are target priority scores and the shapes indicate approved or preclinical compounds to the corresponding target (other disease (squares), anticancer targets (triangles) or those specific to the cancer type considered (rhombus)), or the absence of a compound (circles). Symbols indicate the strength of a genomic biomarker. Selected priority targets are labelled. N A t U r e | www.nature.com/nature