正在加载图片...
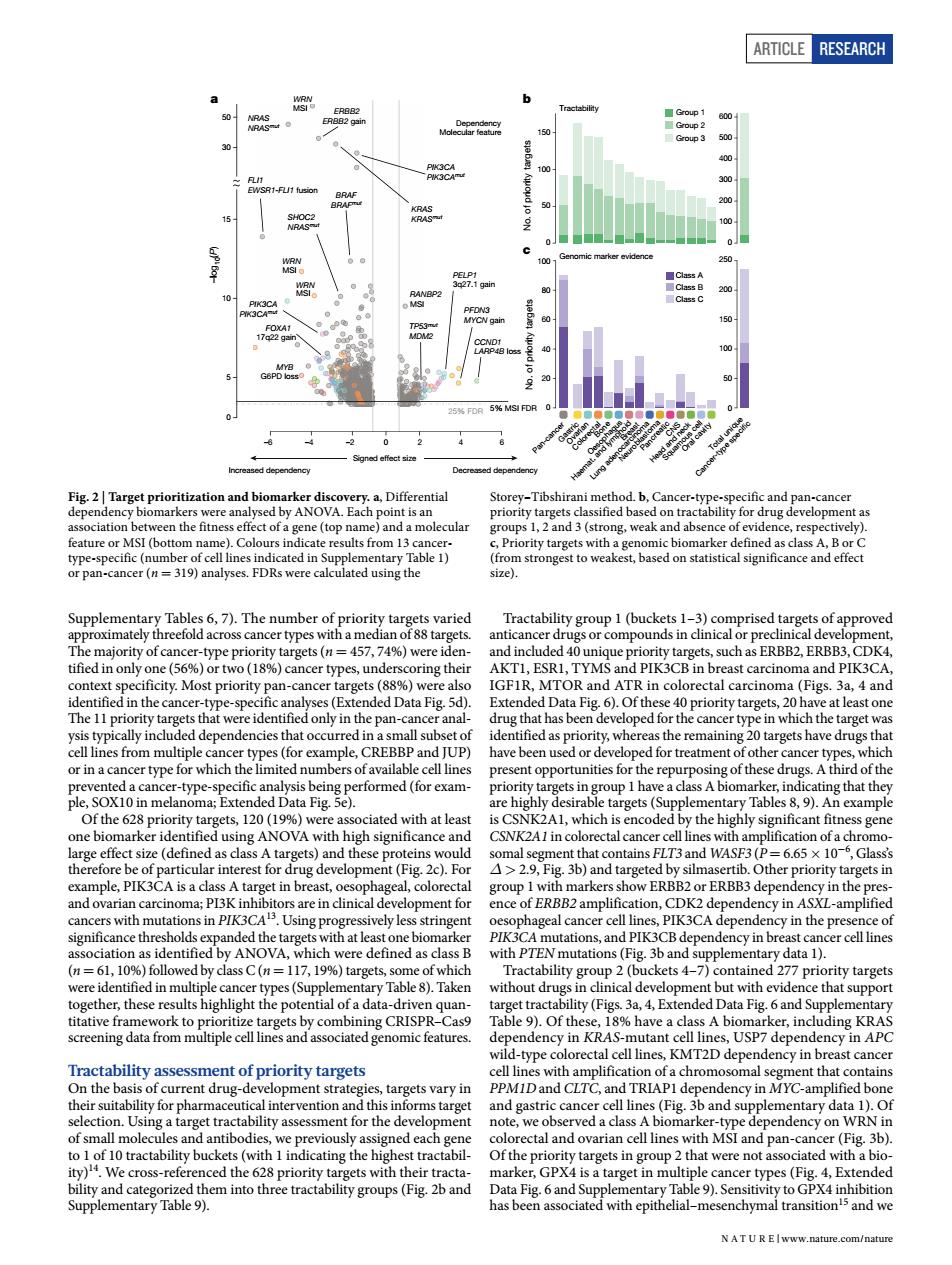
ARTICLE RESEARCH 6 -2 0 50 ation a molecular ups ng.weak nce of e a (P 1 ng thei AKTL.ESRI.TYMS ast carcinoma and PIK3CA TOR idony in the pasu canc the target that nce cer-type- in hat they ciated with at leas ificant fitne OVA CSNK2A1in tal c 29 that c).Fo FLT3 and WASF ig.3b)and ther priority targets in ence of ERBB2amplif on.CDK2 dep cy in ASXL-amplified =11719% ne ets with PT ereidcentinedinmolieleh y Table ) vithout d t with evid ce that of th (h in n KRAS- -type t cance ts vary in ntibod ned each and pan-cance (Fig.3b) s-ref ets with their t GPX4is ncer types(Fig.4,E ded NAT UR EIwww.nature.com/nature Article RESEARCH Supplementary Tables 6, 7). The number of priority targets varied approximately threefold across cancer types with a median of 88 targets. The majority of cancer-type priority targets (n = 457, 74%) were identified in only one (56%) or two (18%) cancer types, underscoring their context specificity. Most priority pan-cancer targets (88%) were also identified in the cancer-type-specific analyses (Extended Data Fig. 5d). The 11 priority targets that were identified only in the pan-cancer analysis typically included dependencies that occurred in a small subset of cell lines from multiple cancer types (for example, CREBBP and JUP) or in a cancer type for which the limited numbers of available cell lines prevented a cancer-type-specific analysis being performed (for example, SOX10 in melanoma; Extended Data Fig. 5e). Of the 628 priority targets, 120 (19%) were associated with at least one biomarker identified using ANOVA with high significance and large effect size (defined as class A targets) and these proteins would therefore be of particular interest for drug development (Fig. 2c). For example, PIK3CA is a class A target in breast, oesophageal, colorectal and ovarian carcinoma; PI3K inhibitors are in clinical development for cancers with mutations in PIK3CA13. Using progressively less stringent significance thresholds expanded the targets with at least one biomarker association as identified by ANOVA, which were defined as class B (n = 61, 10%) followed by class C (n = 117, 19%) targets, some of which were identified in multiple cancer types (Supplementary Table 8). Taken together, these results highlight the potential of a data-driven quantitative framework to prioritize targets by combining CRISPR–Cas9 screening data from multiple cell lines and associated genomic features. Tractability assessment of priority targets On the basis of current drug-development strategies, targets vary in their suitability for pharmaceutical intervention and this informs target selection. Using a target tractability assessment for the development of small molecules and antibodies, we previously assigned each gene to 1 of 10 tractability buckets (with 1 indicating the highest tractability)14. We cross-referenced the 628 priority targets with their tractability and categorized them into three tractability groups (Fig. 2b and Supplementary Table 9). Tractability group 1 (buckets 1–3) comprised targets of approved anticancer drugs or compounds in clinical or preclinical development, and included 40 unique priority targets, such as ERBB2, ERBB3, CDK4, AKT1, ESR1, TYMS and PIK3CB in breast carcinoma and PIK3CA, IGF1R, MTOR and ATR in colorectal carcinoma (Figs. 3a, 4 and Extended Data Fig. 6). Of these 40 priority targets, 20 have at least one drug that has been developed for the cancer type in which the target was identified as priority, whereas the remaining 20 targets have drugs that have been used or developed for treatment of other cancer types, which present opportunities for the repurposing of these drugs. A third of the priority targets in group 1 have a class A biomarker, indicating that they are highly desirable targets (Supplementary Tables 8, 9). An example is CSNK2A1, which is encoded by the highly significant fitness gene CSNK2A1 in colorectal cancer cell lines with amplification of a chromosomal segment that contains FLT3 and WASF3 (P = 6.65 × 10⁻⁶ , Glass’s Δ > 2.9, Fig. 3b) and targeted by silmasertib. Other priority targets in group 1 with markers show ERBB2 or ERBB3 dependency in the presence of ERBB2 amplification, CDK2 dependency in ASXL-amplified oesophageal cancer cell lines, PIK3CA dependency in the presence of PIK3CA mutations, and PIK3CB dependency in breast cancer cell lines with PTEN mutations (Fig. 3b and supplementary data 1). Tractability group 2 (buckets 4–7) contained 277 priority targets without drugs in clinical development but with evidence that support target tractability (Figs. 3a, 4, Extended Data Fig. 6 and Supplementary Table 9). Of these, 18% have a class A biomarker, including KRAS dependency in KRAS-mutant cell lines, USP7 dependency in APC wild-type colorectal cell lines, KMT2D dependency in breast cancer cell lines with amplification of a chromosomal segment that contains PPM1D and CLTC, and TRIAP1 dependency in MYC-amplified bone and gastric cancer cell lines (Fig. 3b and supplementary data 1). Of note, we observed a class A biomarker-type dependency on WRN in colorectal and ovarian cell lines with MSI and pan-cancer (Fig. 3b). Of the priority targets in group 2 that were not associated with a biomarker, GPX4 is a target in multiple cancer types (Fig. 4, Extended Data Fig. 6 and Supplementary Table 9). Sensitivity to GPX4 inhibition has been associated with epithelial–mesenchymal transition15 and we Increased dependency Decreased dependency Signed effect size –log10(P) 30 50 –6 –4 –2 0 246 0 5 10 15 WRN MSI NRAS NRASmut ERBB2 ERBB2 gain KRAS KRASmut PIK3CA PIK3CAmut WRN MSI FLI1 EWSR1-FLI1 fusion WRN MSI BRAF BRAFmut SHOC2 NRASmut MYB G6PD loss PIK3CA PIK3CAmut FOXA1 17q22 gain RANBP2 MSI CCND1 LARP4B loss PFDN3 MYCN gain TP53mut MDM2 PELP1 3q27.1 gain 25% FDR 5% MSI FDR Dependency Molecular feature a Oral cavity Head and neck Squamous cell CNS Pancreatic Neuroblastoma Lung adenocarcinoma Breast Haemat. and lymphoid Oesophagus Bone Colorectal Gastri Ovarian c Pan-cancer Total unique Cancer-type speci c 0 600 500 400 300 200 100 0 250 200 150 100 50 0 100 80 60 40 20 0 150 100 50 No. of priority targets No. of priority targets b Genomic marker evidence Class A Class B Class C Tractability Group 1 Group 2 Group 3 c Fig. 2 | Target prioritization and biomarker discovery. a, Differential dependency biomarkers were analysed by ANOVA. Each point is an association between the fitness effect of a gene (top name) and a molecular feature or MSI (bottom name). Colours indicate results from 13 cancertype-specific (number of cell lines indicated in Supplementary Table 1) or pan-cancer (n = 319) analyses. FDRs were calculated using the Storey–Tibshirani method. b, Cancer-type-specific and pan-cancer priority targets classified based on tractability for drug development as groups 1, 2 and 3 (strong, weak and absence of evidence, respectively). c, Priority targets with a genomic biomarker defined as class A, B or C (from strongest to weakest, based on statistical significance and effect size). N A t U r e | www.nature.com/nature