正在加载图片...

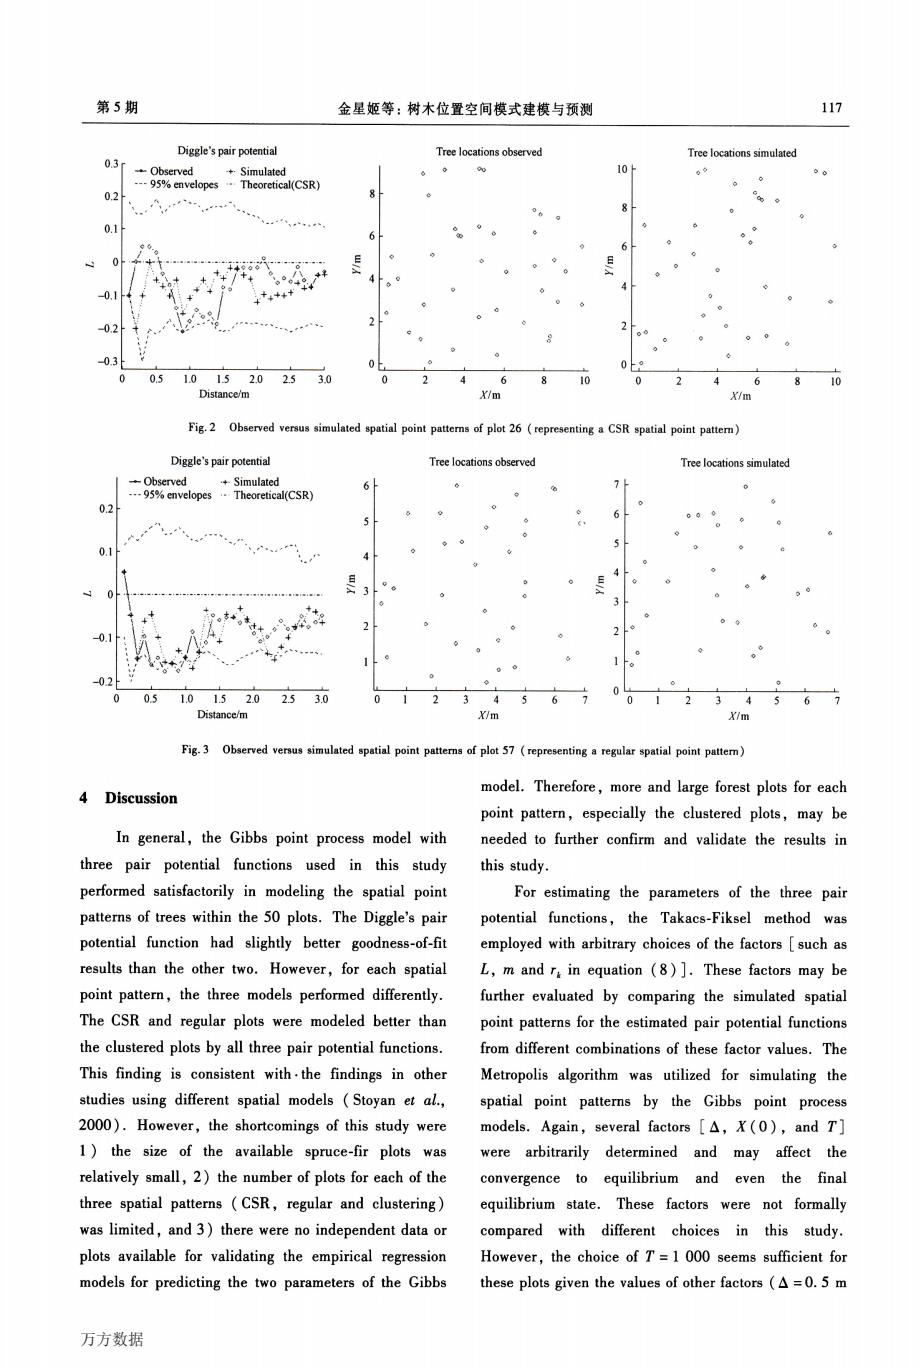
第5期 金星姬等:树木位置空间模式建模与预测 117 Diggle's pair potential Tree locations observed Tree locations simulated 0.3r Observed +Simulated 10 6 03 ---95%envelopesTheoretical(CSR) 0.1 t. + 4 01 0.2 0.3 0 0 05 1.01.52.02.53.0 10 Distance/m X/m X/m Fig.2 Observed versus simulated spatial point patterns of plot 26(representing a CSR spatial point pattern) Diggle's pair potential Tree locations observed Tree locations simulated -Observed +Simulated -95%envelopes Theoretical(CSR) 0.2 0.1 02 05 1.0152.0 2.5 10 Distance/m Y/m Fig.3 Observed versus simulated spatial point patterns of plot 57(representing a regular spatial point patter) 4 Discussion model.Therefore,more and large forest plots for each point pattern,especially the clustered plots,may be In general,the Gibbs point process model with needed to further confirm and validate the results in three pair potential functions used in this study this study. performed satisfactorily in modeling the spatial point For estimating the parameters of the three pair patterns of trees within the 50 plots.The Diggle's pair potential functions,the Takacs-Fiksel method was potential function had slightly better goodness-of-fit employed with arbitrary choices of the factors [such as results than the other two.However,for each spatial L,m and r in equation (8)].These factors may be point pattern,the three models performed differently. further evaluated by comparing the simulated spatial The CSR and regular plots were modeled better than point patterns for the estimated pair potential functions the clustered plots by all three pair potential functions. from different combinations of these factor values.The This finding is consistent with.the findings in other Metropolis algorithm was utilized for simulating the studies using different spatial models (Stoyan et al., spatial point patterns by the Gibbs point process 2000).However,the shortcomings of this study were models.Again,several factors [A,X(0),and T] 1)the size of the available spruce-fir plots was were arbitrarily determined and may affect the relatively small,2)the number of plots for each of the convergence to equilibrium and even the final three spatial patterns (CSR,regular and clustering) equilibrium state.These factors were not formally was limited,and 3)there were no independent data or compared with different choices in this study. plots available for validating the empirical regression However,the choice of T=1 000 seems sufficient for models for predicting the two parameters of the Gibbs these plots given the values of other factors (A=0.5 m 万方数据第5期 金星姬等:树木位置空间模式建模与预测 117 Diggle’s pair potential Distance/m E k Tree locations observed Tree locations simulated x|m x|m Fig.2 Observed versus simulated spatial point patterns of plot 26(representing a CSR spatial point pattern) Diggle’s pair potential 4 Discussion Distance/m 6 4 吕 ≥3 TI℃e locations observed x}m 7 6 5 E 4 王 3 2 1 0 Tree Iocations simulated x|m Fig.3 Observed versus simulated 8patial point patterns。f plot 57(representing a regular spatial point pattern) In general,the Gibbs point process model with three pair potential functions used in this study performed satisfactorily in modeling the spatial point patterns of trees within the 50 plots.The Diggle’s pair potential function had slightly better goodness-of-fit resuIts than the other two.However,for each spatial point pattern,the three models performed differently. The CSR and regular plots were modeled better than the clustered plots by all three pair potential functions. This finding is consistent with·the findings in other studies using different spatial models(Stoyan et a1., 2000).However,the shortcomings of this study were 1)the size of the available spruce—fir plots was relatively small,2)the number of plots for each of the three spatial patterns(CSR,regular and clustering) was limited,and 3)there were no independent data or plots available for validating the empirical regression models for predicting the two parameters of the Gibbs model.Therefore,more and large forest plots for each point pattern,especially the clustered plots,may be needed to further confirm and validate the results in this study. For estimating the parameters of the three pair potential functions,the Takacs—Fiksel method was employed with arbitrary choices of the factors[such as L,m and“in equation(8)].These factors may be further evaluated by comparing the simulated spatial point patterns for the estimated pair potential functions fjom different combinations of these factor values.The Metropolis algorithm was utilized for simulating the spatial point patterns by the Gibbs point process models.Again,several factors[A,X(0),and T] Were arbitrarily determined and may affect the convergence to equilibrium and even the final eauilibrium state.These factors were not formally compared with different choices in this study. However.the choice of T=1 000 seems sufficient for these plots given the values of other factors(A=0.5 m 万方数据