
Optimizing existing large codebase Measire Modemise Mem threads lon Optimizing existing large codebase Sebastien Ponce sebastien.ponce@cern.ch CERN Thematic CERN School of Computing 2018 1/62 S.Ponce-CERN
Optimizing existing large codebase 1 / 62 S. Ponce - CERN Measure Modernize Mem threads low level c/c Optimizing existing large codebase S´ebastien Ponce sebastien.ponce@cern.ch CERN Thematic CERN School of Computing 2018

Optimizing existing large codebase Measuare Mem threads low Outline Measuring Performance The nightmare of thread safety o What is performance oContext and constraints Tools available ldentifying problems o Finding bottlenecks o Solving problems ●Thread contention ②Code modernization 6 Low level optimizations Improving Memory Handling Scope and target o Context o How to measure 。Containers and memory ●Improving o Container reservation o Vectorization promises o Detecting offending code Conclusion 2/62 S.Ponce-CERN
Optimizing existing large codebase 2 / 62 S. Ponce - CERN Measure Modernize Mem threads low level c/c Outline 1 Measuring Performance What is performance ? Tools available Finding bottlenecks 2 Code modernization 3 Improving Memory Handling Context Containers and memory Container reservation Detecting offending code 4 The nightmare of thread safety Context and constraints Identifying problems Solving problems Thread contention 5 Low level optimizations Scope and target How to measure ? Improving Vectorization promises 6 Conclusion
Optimizing existing large codebase 4 Measiare Modemis世Mem thread Goal of this course make the theory explained by Danilo and Andrzej more concrete and adapt it to the special case of dealing with large projects o dealing with legacy code I'll only talk of C+projects 3/62 S.Ponce-CERN
Optimizing existing large codebase 3 / 62 S. Ponce - CERN Measure Modernize Mem threads low level c/c Goal of this course make the theory explained by Danilo and Andrzej more concrete and adapt it to the special case of dealing with large projects dealing with legacy code I’ll only talk of C++ projects
Optimizing existing large codebase Measire Modemise Mem threads Specificity of the exercise Dealing with large code base(Mloc) o most of them unknown to you and(usually)not supported by anyone 。Dealing with old code using old fashion coding style(e.g.FORTRAN like) modified n times,grew organically Target latest hardware many cores hyperthreading superscalar ●vectorization 4/62 S.Ponce-CERN
Optimizing existing large codebase 4 / 62 S. Ponce - CERN Measure Modernize Mem threads low level c/c Specificity of the exercise Dealing with large code base (Mloc) most of them unknown to you and (usually) not supported by anyone Dealing with old code using old fashion coding style (e.g. FORTRAN like) modified n times, grew organically Target latest hardware many cores hyperthreading / superscalar vectorization

Optimizing existing large codebase 4 Measuare Mo6en世Mem threads fo Overall strategy First measure o understand where time is spent o understand the main limitations Then attack these limitations 。modernize the code o optimizing memory handling o optimizing parallelism optimizing low level code 5/62 S.Ponce-CERN
Optimizing existing large codebase 5 / 62 S. Ponce - CERN Measure Modernize Mem threads low level c/c Overall strategy First measure ! understand where time is spent understand the main limitations Then attack these limitations modernize the code optimizing memory handling optimizing parallelism optimizing low level code
Optimizing existing large codebase Measure Mem threads Defining our performance Key question is:what is performance o simply going faster not at all costs(money,physics results) o making better use of the hardware most of the time hardware is cheaper than people o you need to define your "Key Performance Indicators" e.g.nb Evts/s/S with constant man power for a trigger o and get a clear idea of your different costs flops/S of your machines including network,cabling,cooling,buildings,... ◆human costs ●cost of transition perf tools bottlenecks 7/62 S.Ponce-CERN
Optimizing existing large codebase 7 / 62 S. Ponce - CERN Measure Modernize Mem threads low level c/c perf tools bottlenecks Defining our performance Key question is : what is performance simply going faster ? not at all costs (money, physics results) making better use of the hardware most of the time hardware is cheaper than people ! you need to define your “Key Performance Indicators” e.g. nb Evts / s / ✩ with constant man power for a trigger and get a clear idea of your different costs flops/✩ of your machines including network, cabling, cooling, buildings, ... human costs cost of transition
Optimizing existing large codebase Measuring our software Many parameters can be measured o overall timing o memory usage and cache efficiency CPU efficiency (Cycles per instructions,vectorization level) level of parallelism,usage of the different cores I/O limitations if any For each of them,you need both overall data and detailed split per code unit o per item,per core and full machine measurement perf tools bottlenecks 8/62 S.Ponce-CERN
Optimizing existing large codebase 8 / 62 S. Ponce - CERN Measure Modernize Mem threads low level c/c perf tools bottlenecks Measuring our software Many parameters can be measured overall timing memory usage and cache efficiency CPU efficiency (Cycles per instructions, vectorization level) level of parallelism, usage of the different cores I/O limitations if any For each of them, you need both overall data and detailed split per code unit per item, per core and full machine measurement
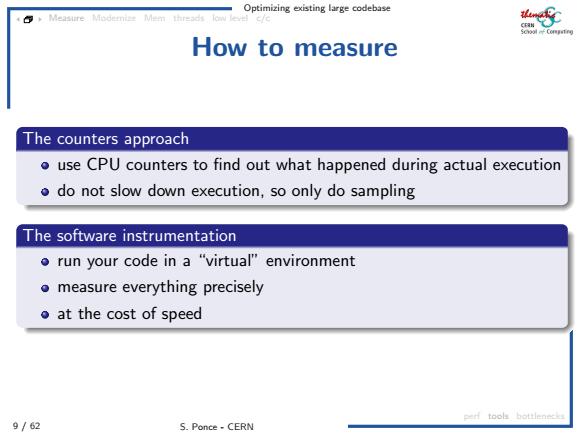
Optimizing existing large codebase How to measure The counters approach o use CPU counters to find out what happened during actual execution o do not slow down execution,so only do sampling The software instrumentation o run your code in a "virtual"environment o measure everything precisely o at the cost of speed perf tools bottlenecks 9/62 S.Ponce-CERN
Optimizing existing large codebase 9 / 62 S. Ponce - CERN Measure Modernize Mem threads low level c/c perf tools bottlenecks How to measure The counters approach use CPU counters to find out what happened during actual execution do not slow down execution, so only do sampling The software instrumentation run your code in a “virtual” environment measure everything precisely at the cost of speed
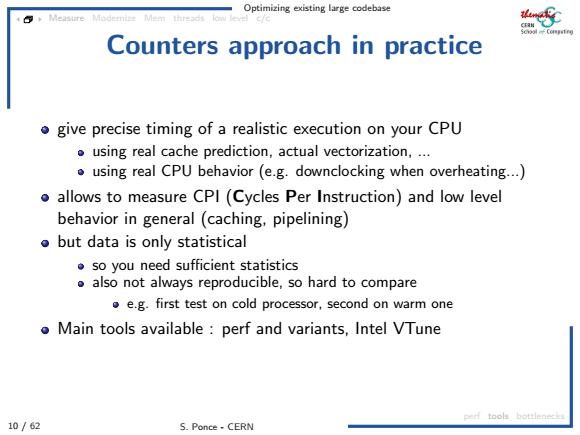
Optimizing existing large codebase Measuire Modemiss Mem threads low Counters approach in practice o give precise timing of a realistic execution on your CPU ousing real cache prediction,actual vectorization,... using real CPU behavior(e.g.downclocking when overheating...) o allows to measure CPI (Cycles Per Instruction)and low level behavior in general (caching,pipelining) but data is only statistical so you need sufficient statistics o also not always reproducible,so hard to compare e.g.first test on cold processor,second on warm one Main tools available:perf and variants,Intel VTune ef tools bottlenecks 10/62 S.Ponce-CERN
Optimizing existing large codebase 10 / 62 S. Ponce - CERN Measure Modernize Mem threads low level c/c perf tools bottlenecks Counters approach in practice give precise timing of a realistic execution on your CPU using real cache prediction, actual vectorization, ... using real CPU behavior (e.g. downclocking when overheating...) allows to measure CPI (Cycles Per Instruction) and low level behavior in general (caching, pipelining) but data is only statistical so you need sufficient statistics also not always reproducible, so hard to compare e.g. first test on cold processor, second on warm one Main tools available : perf and variants, Intel VTune
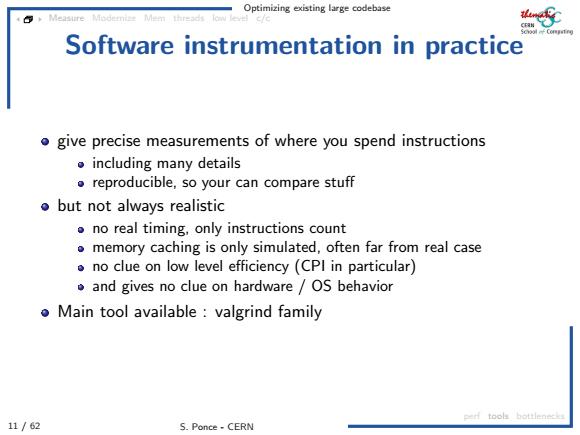
Optimizing existing large codebase Measure Mem threads low Software instrumentation in practice o give precise measurements of where you spend instructions including many details oreproducible,so your can compare stuff but not always realistic no real timing,only instructions count memory caching is only simulated,often far from real case no clue on low level efficiency (CPI in particular) and gives no clue on hardware /OS behavior o Main tool available:valgrind family ef tools bottlenecks 11/62 S.Ponce-CERN
Optimizing existing large codebase 11 / 62 S. Ponce - CERN Measure Modernize Mem threads low level c/c perf tools bottlenecks Software instrumentation in practice give precise measurements of where you spend instructions including many details reproducible, so your can compare stuff but not always realistic no real timing, only instructions count memory caching is only simulated, often far from real case no clue on low level efficiency (CPI in particular) and gives no clue on hardware / OS behavior Main tool available : valgrind family