正在加载图片...

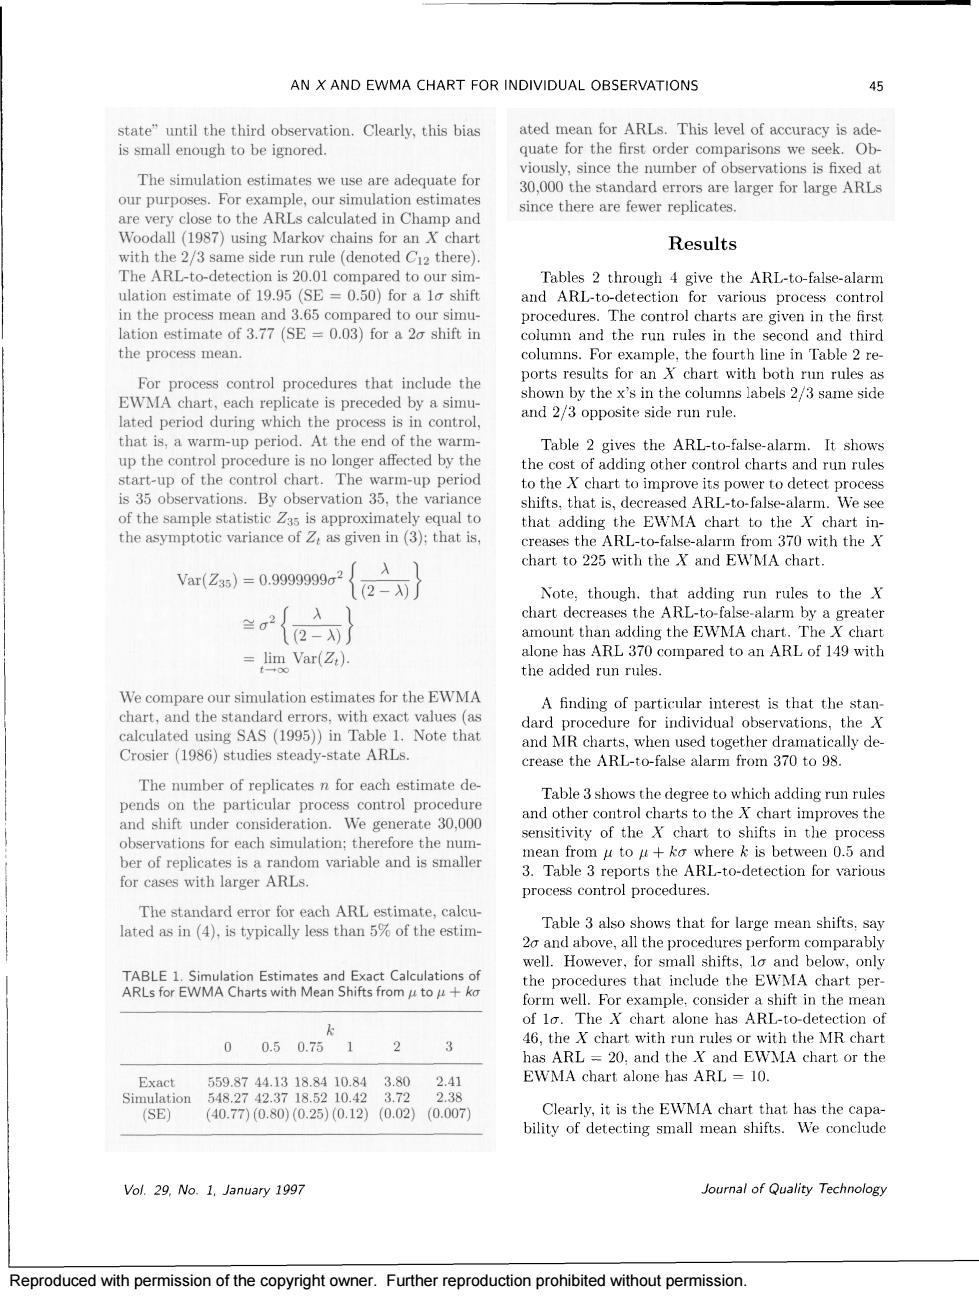
AN X AND EWMA CHART FOR INDIVIDUAL OBSERVATIONS 45 state"until the third ation.Clearly,this bias ated mean for Arls.This level of accuracy is ade is small enough to be ignored. quate for the first order comparisons we seek.Ob The simulation estimates we use are adequate for our purp Sdonsly,since the number ofre arger fonar nxed at since there are fewe Woodall (1987)using Markoy chains for an X chart Results on give the ARI-to-faise-alarn in the proce he r the second an thir anY cha or proces control procedures that include the EWMA chart,each replicate is preceded by a sim wn by the x's in the columns labels 2/3 same side and 2/3 opposite side run rule. up the control procedure is no longer affected by the able It show ochart. he warm-up period oximately equal to shifts,that is,decre ARL-to-fals to the alarm.We see the asymptotic variance of given in (3):that is. hat chart to 225 with the X and EWMA chart. Var(Zs)=0.9999999g 2- Note.though.that adding run rules to the x 兰2 chart decreases ne Al se-alarm by a greater 12- =lim Var(Z) the added run rules ors,with exact vahes (as rease the ARL-to-false alarm from 370 to 9s. The number of replicates n for each estimate de Table 3 shows the degree to which adding run rules under considera We generat 30,00 l charts to the hart improves the shi ber of replicates is a random variable and is smaller for cases with larger ARLs T n 0.5 and process control procedures nd abo that well.However.for small shifts 1a the proc A chart per of lo.The X chart alone has tection of 0 050.751 3 46,the X chart with run rules or with the MR cha MA chart or th 24 (SE) it is the chart tha Vol.29.No.1.January 1997 Joumal of Quality Technology Reproduced with permission of the copyright owner.Further reproduction prohibited without permission.Reproduced with permission of the copyright owner. Further reproduction prohibited without permission