An X and EWMA chart for individual observations An X and EWMA Chart for Individual Observations SUSAN L.ALBIN and LAN KANG Rutgers,The State University of New Jersey.Piscataway.NJ08855 GERALD SHEA Erron Research and Engineering Company.Florham Park,NJ07932 in that both insinge.easily interpreted graph. small shifts in the process mean and large shifts in the process standard deviati Introduction trol ae many indstrial situations where it does not make snse to periodically collect a sampl control cha in the rts:the mple. (19))However.in these texts and elsewhere be Individual observation control charts are ofter carecoineg used to monitor chemical processes where.for ex ponentia average (EV IA)cha can use combinations of these charts and run rules. y.Keats.Bo While there is a wealth of knowledge the al ternatives for monitoring processes with individual unit is measured.They are also cost of measuire of charts andrun rues is most practical and use Dr.Albin is a Pr combinations of the X chart,MR chart.EWMA ring Associate.He is a Member of e-alarm.We als Vol.29.No.1.January 1997 41 Journal of Quality Technology Reproduced with permission of the copyright owner.Further reproduction prohibited without permission
Reproduced with permission of the copyright owner. Further reproduction prohibited without permission. An X and EWMA chart for individual observations Albin, Susan L; Kang, Lan; Shea, Gerald Journal of Quality Technology; Jan 1997; 29, 1; ABI/INFORM Global pg. 41
SUSAN L.ALBIN,LAN KANG.AND GERALD SHEA estimate the ex pected number of obse to da to an X chart.first re ection when the proc s mean or standard deviation has shifted.that is,ARL-to-detection. how that the the ha the ARL-to-false-alarm is large:(2)the ARL introduced by Roberts (1959 and small shifts in the rkenneeitacem pro Hunter (1986 Robinson and Ho dard deviation:(4)these two charts can be graphed wo: a computer program for computing theR (1993)where individual observation process Hunter (1986 hat the EWMA char for sample averages can be nicely graphed simultane ion ously with the Shewhart chart to enable easier inter tory measurement of the same product sample.Since e and (19 calibra ith the X chart tory resut Shea (13) A charts have heom-】 s where the sample statistic is the weighted average properties of the chart used in Shea (1993) of moving ranges Wortham ane (1971)an fvleintrlwoeduresforprocesoarolof for detecting mean shifts and the othefor detect ing variance shifts. MacGregor and Harris (1993 nsiderable hodt of k he chart first CUSUM charts are another important alterna 11 The addition of the MR chart adds the ability to de the USUA tive for individual obs T tect shifts in the standard deviati o.However the had to r such things as the steady state shown in Crowder(1987b)and reiterated here.The feel that other criteria.such as training costs.could f370 be u Nelson (1982)advises the use of the mr Since the effectiveness of the custm and ewma charts are so close,it is clear that 19g ame Do procedure rt and that th bability the MR chart signals an out of length performance of the and EWMA chart we control proces Joural of Quality Technology Vol.29.No.1.January 1997 Reproduced with permission of the copyright owner.Further reproduction prohibited without permission
Reproduced with permission of the copyright owner. Further reproduction prohibited without permission

AN X AND EWMA CHART FOR INDIVIDUAL OBSERVATIONS 43 EWMA chart is so area whereas the CUSUM chart is not. in the EWMA chart than in the MR chart becaus the USUM vations not only the past The mean and variance of Z and the asymptotic oo are E(Z)= tme之ega Individual observatious are drawn from a pr Var(Z)=02 {产}-a- quence ofbe indepenc tributed (iid where see monta s set ena Xt=十t (1 Ah to 02 the asy s mean and is a normally distributed e of the control limits u is the proces e EW random variable with mean 0 and variance g2. assignable charts can be conveniently plotted on the same nd ther with control limits for the X chart at±3 and the the 1993 the at 100 19 and Lucas and Saccucci (1990)for discussion on the EWMA chart.) We now describe the control charts and run rules lesar th The X chart is a graph of the individual obser The sample statist ic is simply X.in chwo run rul co To ach add two warning zones to the chart:the uppe =u-3a.respectivelv. warning zone is between +2o and the upper contr ths the nd the loer Te is be u-2 Here we usen 2/3 Same Side:If two out of three consecutive -2:thus the sample statistic is R:=X: points fall on the same side of the center line bu X-1 ThecoptrolimitsareUg DaR and LC hdsrmming2one,anoutofcontralconditioni e average o 2/3 Opposite Side:If two out of three consed in Montgomery(1996).The false alarm rate for this points fall on opposite sides of the center line tha D. 27 as shown an of this r pendent.the R are th an increase in the proces s standard deviation or th For the EWMA chart the sample statistic is a a mixture.If successive sample observa of thus indicating a shift.Violating the rule tion receiving the most weight.i.e. is similar to finding R outside the control limits on Z=X:+(1-A)Z-1 0<<1 (2 hart is to te the MR ch where Zo=u.As in the MR chart,the X are inde The process control procedures considered in thi pendent butt sample statistics are autocorrelated with and withou Vol.29.No.1.January 1997 Journal of Quality Technology Reproduced with permission of the copyright owner.Further reproduction prohibited without permission
Reproduced with permission of the copyright owner. Further reproduction prohibited without permission
44 SUSAN L.ALBIN.LAN KANG.AND GERALD SHEA run rules.that is:(1)no run rules:(2)2/3 Sam Here.simulation is used to estimate Aris for all Side rule only:(3)2/3 Opposite Side rule the pro s control procedures,except the chart one ativewould have been to mpe simulate the X and MR te X Chart with and without Run Rules:Thes runs rules.We choose to use simulation.Essentially (with less htty lines of code) and MR Charts with Rules alternatives and without Rur graphs. The X en 110 X and EWMA Chart with and without Run se published results and numerical calculations to Rules:These alternatives are convenient,again, that there is ony one grapl For the simulation.the in-control process has interpretation and standard deviation 1,without loss of shina shift 3,and 4.The 品0A222 Each ARL is estimated by simulating n indepen The arls for an x chart a replicates of the process The replicates yield a outside of the false-alarm is 1/a=370 where a =0.0027 is the fals The estimate o s standard error are detection is 1/3 whereis the probability a specified i=∑ shift is detected on one observation run rules the MR chart,an () the where etween 8=n-1 dramdM procedure to solve integ quations to find ARLs ias in the To find ARLs for the EWMA Crowder (1987a)use first observation an alarm can occur only if the ob EWMA d EWMA n A ion is outside the art control l if the oh c)nd acccei and Lucas (use the ervation is outside the x chart or Mr chart control imits.For the third and remaining observatio with run rules by applying concepts in Champ and r MR chart control limits o 1 Voodal1(1987. Thus the control procedure does not reach a"steady ournal of Quality Technology Vol.29,No.1.January 1997 Reproduced with permission of the copyright owner.Further reproduction prohibited without permission
Reproduced with permission of the copyright owner. Further reproduction prohibited without permission
AN X AND EWMA CHART FOR INDIVIDUAL OBSERVATIONS 45 state"until the third ation.Clearly,this bias ated mean for Arls.This level of accuracy is ade is small enough to be ignored. quate for the first order comparisons we seek.Ob The simulation estimates we use are adequate for our purp Sdonsly,since the number ofre arger fonar nxed at since there are fewe Woodall (1987)using Markoy chains for an X chart Results on give the ARI-to-faise-alarn in the proce he r the second an thir anY cha or proces control procedures that include the EWMA chart,each replicate is preceded by a sim wn by the x's in the columns labels 2/3 same side and 2/3 opposite side run rule. up the control procedure is no longer affected by the able It show ochart. he warm-up period oximately equal to shifts,that is,decre ARL-to-fals to the alarm.We see the asymptotic variance of given in (3):that is. hat chart to 225 with the X and EWMA chart. Var(Zs)=0.9999999g 2- Note.though.that adding run rules to the x 兰2 chart decreases ne Al se-alarm by a greater 12- =lim Var(Z) the added run rules ors,with exact vahes (as rease the ARL-to-false alarm from 370 to 9s. The number of replicates n for each estimate de Table 3 shows the degree to which adding run rules under considera We generat 30,00 l charts to the hart improves the shi ber of replicates is a random variable and is smaller for cases with larger ARLs T n 0.5 and process control procedures nd abo that well.However.for small shifts 1a the proc A chart per of lo.The X chart alone has tection of 0 050.751 3 46,the X chart with run rules or with the MR cha MA chart or th 24 (SE) it is the chart tha Vol.29.No.1.January 1997 Joumal of Quality Technology Reproduced with permission of the copyright owner.Further reproduction prohibited without permission
Reproduced with permission of the copyright owner. Further reproduction prohibited without permission
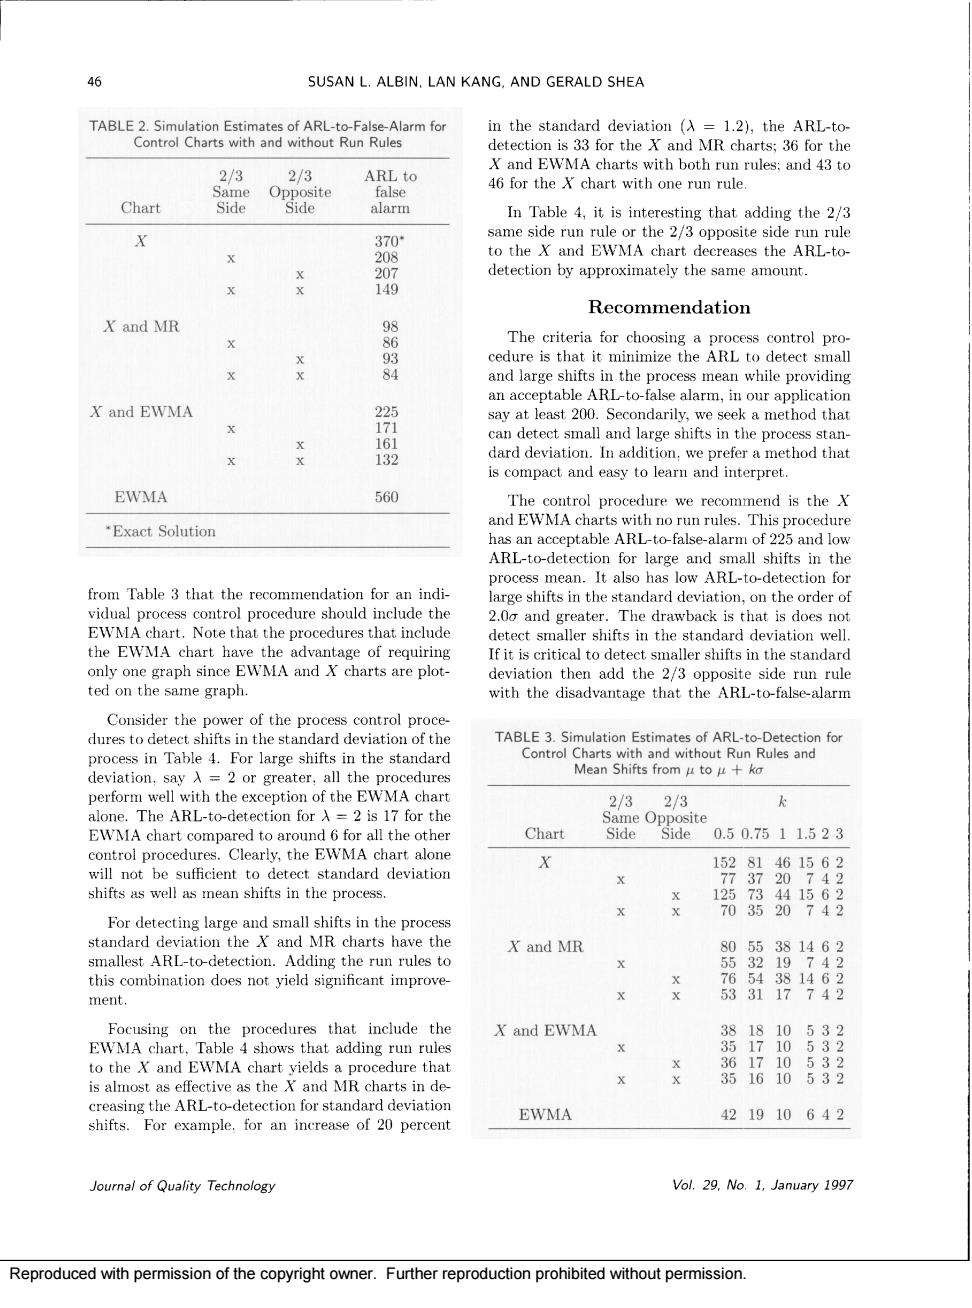
46 SUSAN L.ALBIN.LAN KANG.AND GERALD SHEA TABLE2.Simu ation Esti ates of ARL-to-False-Alarm for in the standard deviation (A =1.2).the Arl-to Control Charts with and without Run Rules detection is 33 for the X and MR charts:36 for the 2/ 2/3 ARL to Chart Side alarm In Table 4,it is interesting that adding the 2/3 detection by approximately the same amount. Recommendation X and MR 9898 X and EWMA can detect large shifts in the raaethodtha EWMA 560 -Exact Solution 225d ARLto-detection for large and small shifts in the rocess It also has wARL-to-detection for indi ard de on the Note that the procedures that include detect smaller shifts in the standard deviation well ne E smaller shifts in the st andar that the ARl TABLE3.Simulation Estimates of ARL-t-Detection for process in Table 4.For large shifts in the standard Control Mean Shifts fromt ules and deviation,sayA 23 2/3 k EWMA chart compared to around 6 for all the other Chart side08e0.50.7511.523 X For detecting large and small shifts in the proces harts X and MR this combination does not yield significant improve ment. X and EWMA to the X and EWMA chart yields a procedure that is almost as eff and N EWMA 421910642 loural of Quality Technology Vol.29.No 1.January 1997 Reproduced with permission of the copyright owner Further reprod vithout permission
Reproduced with permission of the copyright owner. Further reproduction prohibited without permission

AN X AND EWMA CHART FOR INDIVIDUAL OBSERVATIONS Standard Deviation Shifts fromto Quality Co i28.pp.187-191 Chart 1.21.522.53 Bu-lensth Dis 33 d Mo X and MR Control Charts 1,pP155-162 X and EWMA 18. EWMA 143461796 p.2083-210. method is convenient in that nd Ha dM店 that the fals s mean can be detected.Further pT.D.W.and.D.L (1902)- "Twin Met A char EWNA chart aone because it detects shifts in the ,W.pp.36-37 process standard deviation. he CUSUM chart in not familia t one c ton proce fective as the X and EWMA chart.Clearly,if the S.().Co Charts for Individual Me 99 14:Pp.I we would 2m Acknowledgments T.Y.( 20.pp.8 References SAS.ING mmetrics34.DD.251-25 Veraon 60.SAS Institute,Inc.,Cary.NC Vol.29.No.1.January 1997 Joural of Quality Technology Reproduced with permission of the copyright owner.Further reproduction prohibited without permission
Reproduced with permission of the copyright owner. Further reproduction prohibited without permission
SUSAN L.ALBIN.LAN KANG.AND GERALD SHEA .M.S.and LecAs.J.M. (190).“Average Run f Handbook.Western Electrie Company,Indianapo is.IN.p. G.(1993)C:s 62p Moving Range Control Charts,X Control Joural of Quality Technology Vol.29.No.1,January 1997 Reproduced with permission of the copyright owner.Further reproduction prohibited without permission
Reproduced with permission of the copyright owner. Further reproduction prohibited without permission