正在加载图片...

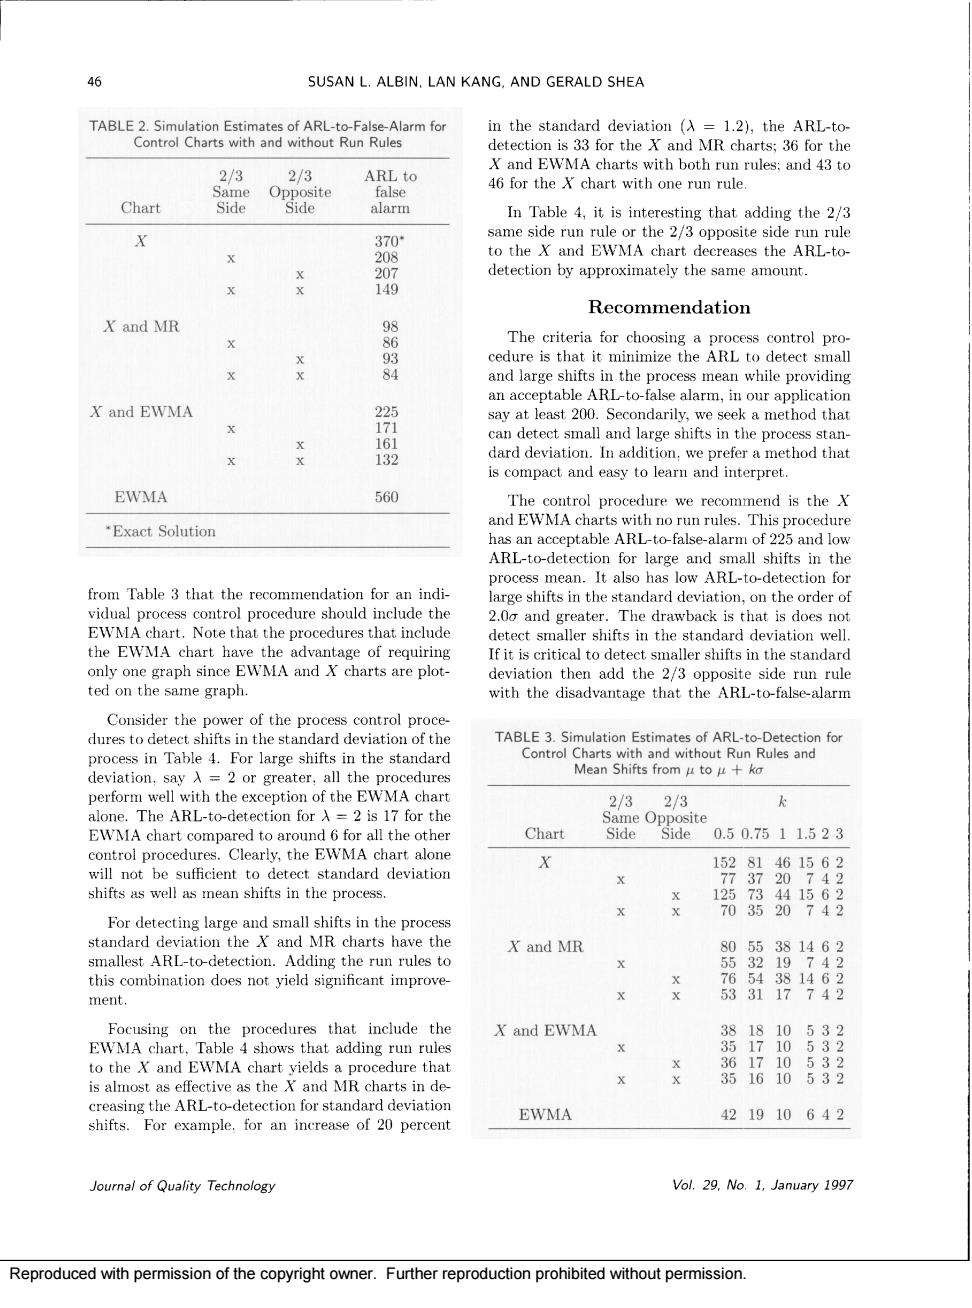
46 SUSAN L.ALBIN.LAN KANG.AND GERALD SHEA TABLE2.Simu ation Esti ates of ARL-to-False-Alarm for in the standard deviation (A =1.2).the Arl-to Control Charts with and without Run Rules detection is 33 for the X and MR charts:36 for the 2/ 2/3 ARL to Chart Side alarm In Table 4,it is interesting that adding the 2/3 detection by approximately the same amount. Recommendation X and MR 9898 X and EWMA can detect large shifts in the raaethodtha EWMA 560 -Exact Solution 225d ARLto-detection for large and small shifts in the rocess It also has wARL-to-detection for indi ard de on the Note that the procedures that include detect smaller shifts in the standard deviation well ne E smaller shifts in the st andar that the ARl TABLE3.Simulation Estimates of ARL-t-Detection for process in Table 4.For large shifts in the standard Control Mean Shifts fromt ules and deviation,sayA 23 2/3 k EWMA chart compared to around 6 for all the other Chart side08e0.50.7511.523 X For detecting large and small shifts in the proces harts X and MR this combination does not yield significant improve ment. X and EWMA to the X and EWMA chart yields a procedure that is almost as eff and N EWMA 421910642 loural of Quality Technology Vol.29.No 1.January 1997 Reproduced with permission of the copyright owner Further reprod vithout permission. Reproduced with permission of the copyright owner. Further reproduction prohibited without permission