正在加载图片...
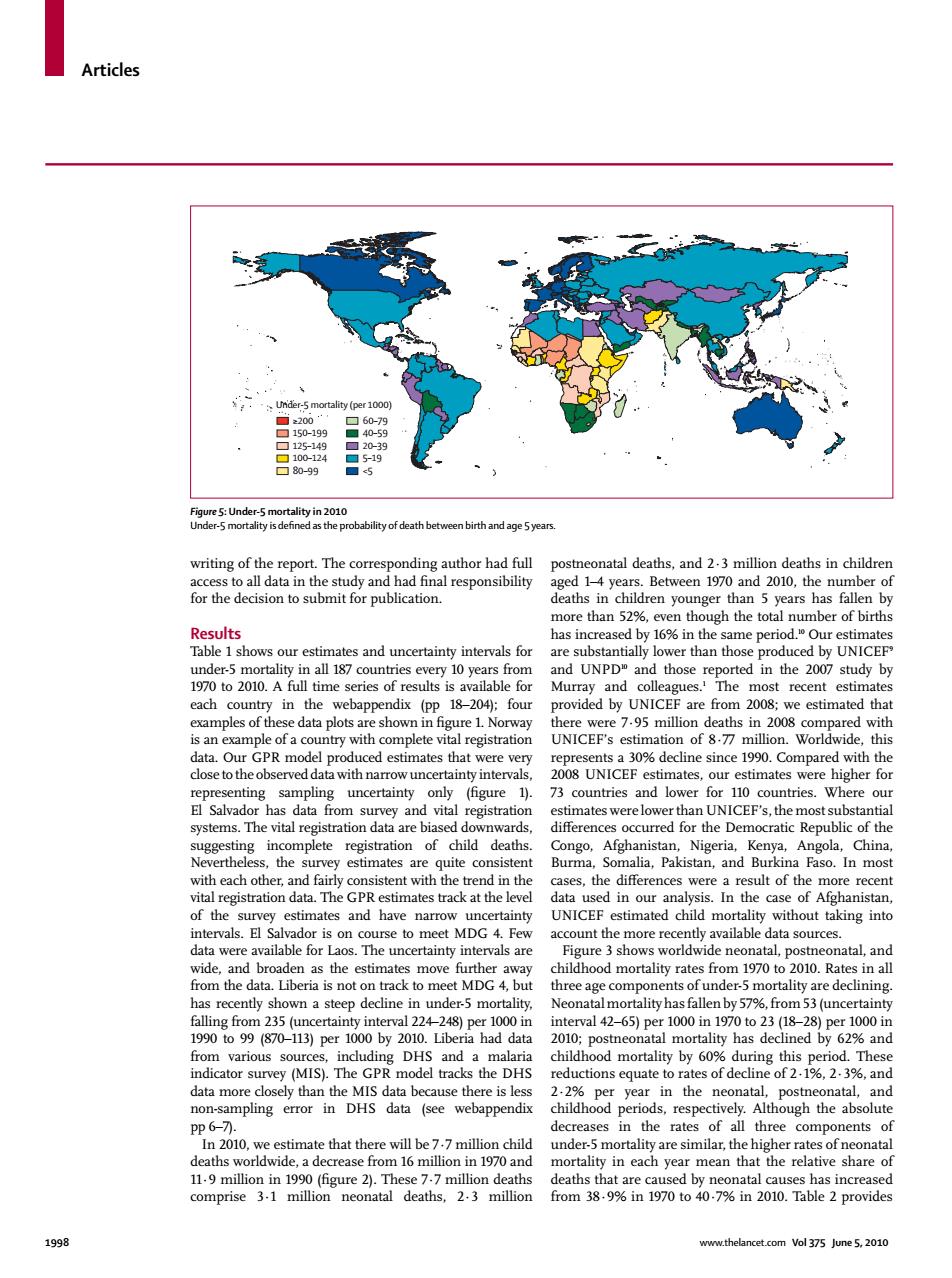
Articles Unider-5 mortality (per 1000) ☐2200 ☐60-79 ☐150-199 40-59 ☐125-149 ☐20-39 100-124 ☐5-19 ▣80-99 <5 Figure 5:Under-5 mortality in 2010 Under-5 mortality is defined as the probability of death between birth and age 5years. writing of the report.The corresponding author had full postneonatal deaths,and 2.3 million deaths in children access to all data in the study and had final responsibility aged 1-4 years.Between 1970 and 2010,the number of for the decision to submit for publication. deaths in children younger than 5 years has fallen by more than 52%,even though the total number of births Results has increased by 16%in the same period.Our estimates Table 1 shows our estimates and uncertainty intervals for are substantially lower than those produced by UNICEF under-5 mortality in all 187 countries every 10 years from and UNPD and those reported in the 2007 study by 1970 to 2010.A full time series of results is available for Murray and colleagues.The most recent estimates each country in the webappendix (pp 18-204);four provided by UNICEF are from 2008;we estimated that examples of these data plots are shown in figure 1.Norway there were 7.95 million deaths in 2008 compared with is an example of a country with complete vital registration UNICEF's estimation of 877 million.Worldwide.this data.Our GPR model produced estimates that were very represents a 30%decline since 1990.Compared with the close to the observed data with narrow uncertainty intervals. 2008 UNICEF estimates,our estimates were higher for representing sampling uncertainty only (figure 1). 73 countries and lower for 110 countries.Where our El Salvador has data from survey and vital registration estimates were lower than UNICEF's,the most substantial systems.The vital registration data are biased downwards, differences occurred for the Democratic Republic of the suggesting incomplete registration of child deaths. Congo,Afghanistan,Nigeria,Kenya,Angola,China, Nevertheless,the survey estimates are quite consistent Burma,Somalia,Pakistan,and Burkina Faso.In most with each other,and fairly consistent with the trend in the cases,the differences were a result of the more recent vital registration data.The GPR estimates track at the level data used in our analysis.In the case of Afghanistan, of the survey estimates and have narrow uncertainty UNICEF estimated child mortality without taking into intervals.El Salvador is on course to meet MDG 4.Few account the more recently available data sources. data were available for Laos.The uncertainty intervals are Figure 3 shows worldwide neonatal,postneonatal,and wide,and broaden as the estimates move further away childhood mortality rates from 1970 to 2010.Rates in all from the data.Liberia is not on track to meet MDG 4.but three age components of under-5 mortality are declining has recently shown a steep decline in under-5 mortality. Neonatal mortality has fallen by 57%,from 53(uncertainty falling from 235 (uncertainty interval 224-248)per 1000 in interval 42-65)per 1000 in 1970 to 23(18-28)per 1000 in 1990 to 99 (870-113)per 1000 by 2010.Liberia had data 2010:postneonatal mortality has declined by 62%and from various sources,including DHS and a malaria childhood mortality by 60%during this period.These indicator survey (MIS).The GPR model tracks the DHS reductions equate to rates of decline of 2.1%,2.3%,and data more closely than the MIS data because there is less 2.2%per year in the neonatal,postneonatal,and non-sampling error in DHS data (see webappendix childhood periods,respectively.Although the absolute PP6-7. decreases in the rates of all three components of In 2010,we estimate that there will be 7.7 million child under-5 mortality are similar,the higher rates of neonatal deaths worldwide,a decrease from 16 million in 1970 and mortality in each year mean that the relative share of 11.9 million in 1990(figure 2).These 7.7 million deaths deaths that are caused by neonatal causes has increased comprise 3.1 million neonatal deaths,2.3 million from 38.9%in 1970 to 40.7%in 2010.Table 2 provides 1998 www.thelancet.com Vol 375 June 5,2010Articles 1998 www.thelancet.com Vol 375 June 5, 2010 writing of the report. The corresponding author had full access to all data in the study and had fi nal responsibility for the decision to submit for publication. Results Table 1 shows our estimates and uncertainty intervals for under-5 mortality in all 187 countries every 10 years from 1970 to 2010. A full time series of results is available for each country in the webappendix (pp 18–204); four examples of these data plots are shown in fi gure 1. Norway is an example of a country with complete vital registration data. Our GPR model produced estimates that were very close to the observed data with narrow uncertainty intervals, representing sampling uncertainty only (fi gure 1). El Salvador has data from survey and vital registration systems. The vital registration data are biased downwards, suggesting incomplete registration of child deaths. Nevertheless, the survey estimates are quite consistent with each other, and fairly consistent with the trend in the vital registration data. The GPR estimates track at the level of the survey estimates and have narrow uncertainty intervals. El Salvador is on course to meet MDG 4. Few data were available for Laos. The uncertainty intervals are wide, and broaden as the estimates move further away from the data. Liberia is not on track to meet MDG 4, but has recently shown a steep decline in under-5 mortality, falling from 235 (uncertainty interval 224–248) per 1000 in 1990 to 99 (870–113) per 1000 by 2010. Liberia had data from various sources, including DHS and a malaria indicator survey (MIS). The GPR model tracks the DHS data more closely than the MIS data because there is less non-sampling error in DHS data (see webappendix pp 6–7). In 2010, we estimate that there will be 7·7 million child deaths worldwide, a decrease from 16 million in 1970 and 11·9 million in 1990 (fi gure 2). These 7·7 million deaths comprise 3·1 million neonatal deaths, 2·3 million postneonatal deaths, and 2·3 million deaths in children aged 1–4 years. Between 1970 and 2010, the number of deaths in children younger than 5 years has fallen by more than 52%, even though the total number of births has increased by 16% in the same period.10 Our estimates are substantially lower than those produced by UNICEF9 and UNPD10 and those reported in the 2007 study by Murray and colleagues.1 The most recent estimates provided by UNICEF are from 2008; we estimated that there were 7·95 million deaths in 2008 compared with UNICEF’s estimation of 8·77 million. Worldwide, this represents a 30% decline since 1990. Compared with the 2008 UNICEF estimates, our estimates were higher for 73 countries and lower for 110 countries. Where our estimates were lower than UNICEF’s, the most substantial diff erences occurred for the Democratic Republic of the Congo, Afghanistan, Nigeria, Kenya, Angola, China, Burma, Somalia, Pakistan, and Burkina Faso. In most cases, the diff erences were a result of the more recent data used in our analysis. In the case of Afghanistan, UNICEF estimated child mortality without taking into account the more recently available data sources. Figure 3 shows worldwide neonatal, postneonatal, and childhood mortality rates from 1970 to 2010. Rates in all three age components of under-5 mortality are declining. Neonatal mortality has fallen by 57%, from 53 (uncertainty interval 42–65) per 1000 in 1970 to 23 (18–28) per 1000 in 2010; postneonatal mortality has declined by 62% and childhood mortality by 60% during this period. These reductions equate to rates of decline of 2·1%, 2·3%, and 2·2% per year in the neonatal, postneonatal, and childhood periods, respectively. Although the absolute decreases in the rates of all three components of under-5 mortality are similar, the higher rates of neonatal mortality in each year mean that the relative share of deaths that are caused by neonatal causes has increased from 38·9% in 1970 to 40·7% in 2010. Table 2 provides Figure 5: Under-5 mortality in 2010 Under-5 mortality is defi ned as the probability of death between birth and age 5 years. Under-5 mortality (per 1000) ≥200 150–199 125–149 100–124 80–99 60–79 40–59 20–39 5–19 <5