正在加载图片...
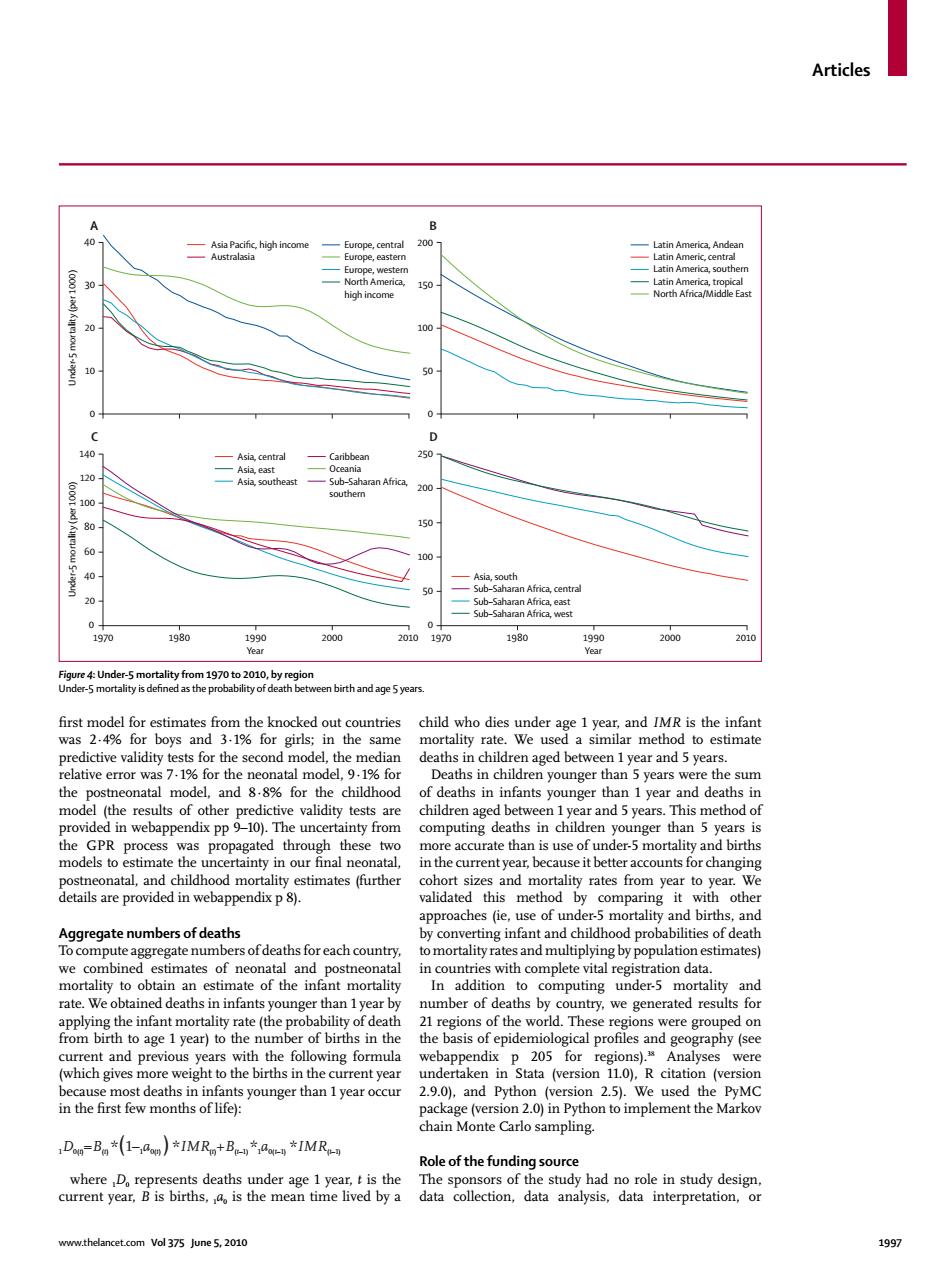
Articles A B -Asia Pacific,high income Europe,central 200 Latin America.Andean -Australasia -Europe,eastern -Latin Americ.central Europe,wester Latin America,southern (1000m North America. 150 Latin America,tropical high income -North Africa/Middle East 100 10 50 0 0 140 —Asia,central Caribbean 250 —Asia east -Oceania 120 一Asia,southeast -Sub-Saharan Africa, (000 southern 200 150 60 100 Asia.south 50 Sub-Saharan Africa,central 20 Sub-Saharan Africa,east Sub-Saharan Africa,west 0 1970 1980 1990 2000 2010 1970 1980 1990 2000 2010 Year Year Figure 4:Under-5 mortality from 1970 to 2010,by region Under-5 mortality is defined as the probability of death between birth and age 5 years first model for estimates from the knocked out countries child who dies under age 1 year,and IMR is the infant was 2.4%for boys and 3.1%for girls;in the same mortality rate.We used a similar method to estimate predictive validity tests for the second model,the median deaths in children aged between 1 year and 5 years. relative error was 7.1%for the neonatal model,9.1%for Deaths in children younger than 5 years were the sum the postneonatal model,and 8.8%for the childhood of deaths in infants younger than 1 year and deaths in model (the results of other predictive validity tests are children aged between 1 year and 5 years.This method of provided in webappendix pp 9-10).The uncertainty from computing deaths in children younger than 5 years is the GPR process was propagated through these two more accurate than is use of under-5 mortality and births models to estimate the uncertainty in our final neonatal, in the current year,because it better accounts for changing postneonatal,and childhood mortality estimates (further cohort sizes and mortality rates from year to year.We details are provided in webappendix p 8). validated this method by comparing it with other approaches (ie,use of under-5 mortality and births,and Aggregate numbers of deaths by converting infant and childhood probabilities of death To compute aggregate numbers of deaths for each country, to mortality rates and multiplying by population estimates) we combined estimates of neonatal and postneonatal in countries with complete vital registration data. mortality to obtain an estimate of the infant mortality In addition to computing under-5 mortality and rate.We obtained deaths in infants younger than 1 year by number of deaths by country,we generated results for applying the infant mortality rate(the probability of death 21 regions of the world.These regions were grouped on from birth to age 1 year)to the number of births in the the basis of epidemiological profiles and geography (see current and previous years with the following formula webappendix p 205 for regions).Analyses were (which gives more weight to the births in the current year undertaken in Stata (version 11.0),R citation (version because most deaths in infants younger than 1 year occur 2.9.0),and Python (version 2.5).We used the PyMC in the first few months of life): package (version 2.0)in Python to implement the Markov chain Monte Carlo sampling. Don-Bo*(1-aon)*IMRn+B*do*IMRom Role of the funding source where D.represents deaths under age 1 year,t is the The sponsors of the study had no role in study design, current year,B is births,d is the mean time lived by a data collection,data analysis,data interpretation,or www.thelancet.com Vol 375 June 5,2010 1997Articles www.thelancet.com Vol 375 June 5, 2010 1997 fi rst model for estimates from the knocked out countries was 2·4% for boys and 3·1% for girls; in the same predictive validity tests for the second model, the median relative error was 7·1% for the neonatal model, 9·1% for the postneonatal model, and 8·8% for the childhood model (the results of other predictive validity tests are provided in webappendix pp 9–10). The uncertainty from the GPR process was propagated through these two models to estimate the uncertainty in our fi nal neonatal, postneonatal, and childhood mortality estimates (further details are provided in webappendix p 8). Aggregate numbers of deaths To compute aggregate numbers of deaths for each country, we combined estimates of neonatal and postneonatal mortality to obtain an estimate of the infant mortality rate. We obtained deaths in infants younger than 1 year by applying the infant mortality rate (the probability of death from birth to age 1 year) to the number of births in the current and previous years with the following formula (which gives more weight to the births in the current year because most deaths in infants younger than 1 year occur in the fi rst few months of life): where 1D0 represents deaths under age 1 year, t is the current year, B is births, 1a0 is the mean time lived by a child who dies under age 1 year, and IMR is the infant mortality rate. We used a similar method to estimate deaths in children aged between 1 year and 5 years. Deaths in children younger than 5 years were the sum of deaths in infants younger than 1 year and deaths in children aged between 1 year and 5 years. This method of computing deaths in children younger than 5 years is more accurate than is use of under-5 mortality and births in the current year, because it better accounts for changing cohort sizes and mortality rates from year to year. We validated this method by comparing it with other approaches (ie, use of under-5 mortality and births, and by converting infant and childhood probabilities of death to mortality rates and multiplying by population estimates) in countries with complete vital registration data. In addition to computing under-5 mortality and number of deaths by country, we generated results for 21 regions of the world. These regions were grouped on the basis of epidemiological profi les and geography (see webappendix p 205 for regions).38 Analyses were undertaken in Stata (version 11.0), R citation (version 2.9.0), and Python (version 2.5). We used the PyMC package (version 2.0) in Python to implement the Markov chain Monte Carlo sampling. Role of the funding source The sponsors of the study had no role in study design, data collection, data analysis, data interpretation, or Figure 4: Under-5 mortality from 1970 to 2010, by region Under-5 mortality is defi ned as the probability of death between birth and age 5 years. Under-5 mortality (per 1000) 0 10 20 30 0 50 100 150 40 200 Caribbean Oceania Sub–Saharan Africa, southern Asia, south Sub–Saharan Africa, central Sub–Saharan Africa, east Sub–Saharan Africa, west A B Europe, central Europe, eastern Europe, western North America, high income Asia Pacific, high income Australasia Latin America, Andean Latin Americ, central Latin America, southern Latin America, tropical North Africa/Middle East Under-5 mortality (per 1000) Year 0 1970 1980 1990 2000 2010 20 40 80 0 50 100 150 140 250 120 60 100 C Year 200 1970 1980 1990 2000 2010 D Asia, central Asia, east Asia, southeast 1D0(t) =B(t) * 1–1a0(t) *IMR(t) +B(t–1) *1a0(t–1) *IMR(t–1) ( )