正在加载图片...
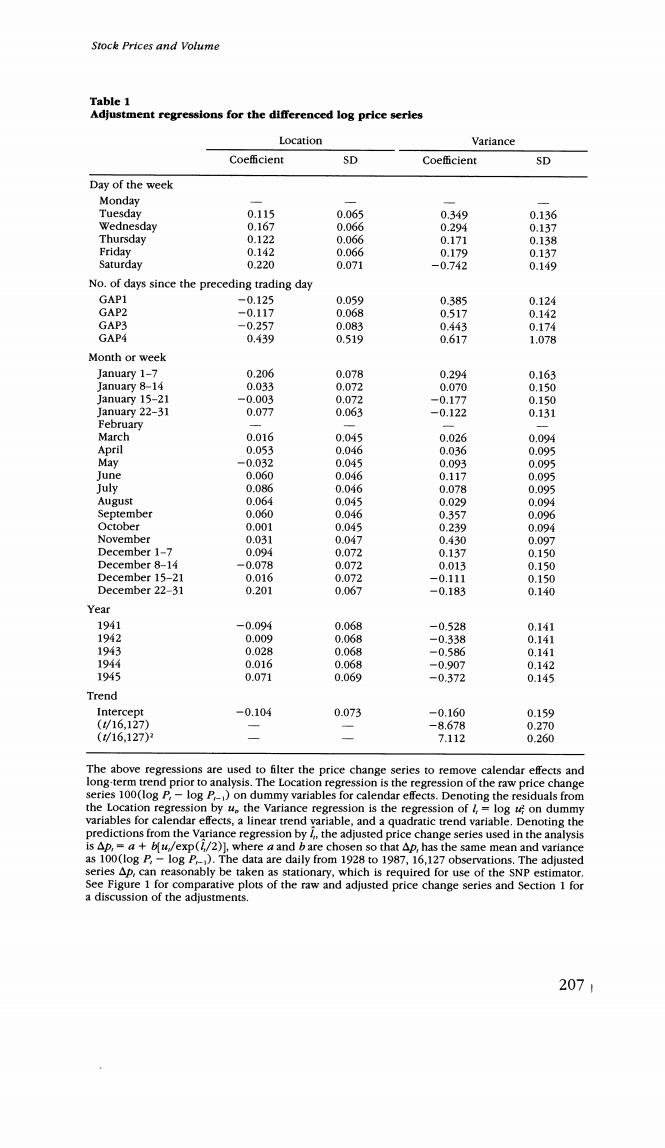
Stock Prices and Volume Table 1 Adjustment regressions for the differenced log price serles Location Variance Coefficient SD Coe伍cient SD Day of the week Monday Tuesday 0.115 0.065 0.349 0.136 Wednesday 0.167 0.066 0.294 0.137 Thursday 0.122 0.066 0.171 0.138 Friday 0.142 0.066 0.179 0.137 Saturday 0.220 0.071 -0.742 0.149 No.of days since the preceding trading day GAP1 -0.125 0.059 0.385 0.124 GAP2 -0.117 0.068 0.517 0.142 GAP3 -0.257 0.083 0.443 0.174 GAP4 0.439 0.519 0.617 1.078 Month or week January 1-7 0.206 0.078 0.294 0.163 January 8-14 0.033 0.072 0.070 0.150 January 15-21 -0.003 0.072 -0.177 0.150 January 22-31 0.077 0.063 -0.122 0.131 February March 0.016 0.045 0.026 0.094 April 0.053 0.046 0.036 0.095 May -0.032 0.045 0.093 0.095 lune 0.060 0.046 0.117 0.095 July 0.086 0.046 0.078 0095 August 0.064 0.045 0.029 0.094 September 0.060 0.046 0.357 0.096 October 0.001 0.045 0.239 0.094 November 0.031 0.047 0.430 0.097 December 1-7 0.094 0.072 0.137 0.150 December 8-14 -0.078 0.072 0.013 0.150 December 15-21 0.016 0.072 -0.111 0.150 December 22-31 0.201 0.067 -0.183 0.140 Year 1941 -0.094 0.068 -0.528 0.141 1942 0.009 0.068 -0.338 0.141 1943 0.028 0.068 -0.586 0.141 1944 0.016 0.068 =0.907 0.142 1945 0.071 0.069 -0.372 0.145 Trend Intercept -0.104 0.073 -0.160 0.159 (/16,127) -8.678 0.270 (16.127) 7.112 0.260 The above regressions are used to filter the price change series to remove calendar effects and long-term trend prior to analysis.The Location regression is the regression of the raw price change series 100(log P,-log P-)on dummy variables for calendar effects.Denoting the residuals from the Location regression by ue the variance regression is the regression of /,log u;on dummy variables for calendar effects,a linear trend variable,and a quadratic trend variable.Denoting the predictions from the Variance regression by the adjusted price change series used in the analysis is Ap,=a+bfu/exp(/2)],where a and b are chosen so that Ap,has the same mean and variance as 100(log P,-log P).The data are daily from 1928 to 1987,16,127 observations.The adjusted series Ap,can reasonably be taken as stationary,which is required for use of the SNP estimator See Figure 1 for comparative plots of the raw and adjusted price change series and Section 1 for a discussion of the adjustments. 207