正在加载图片...
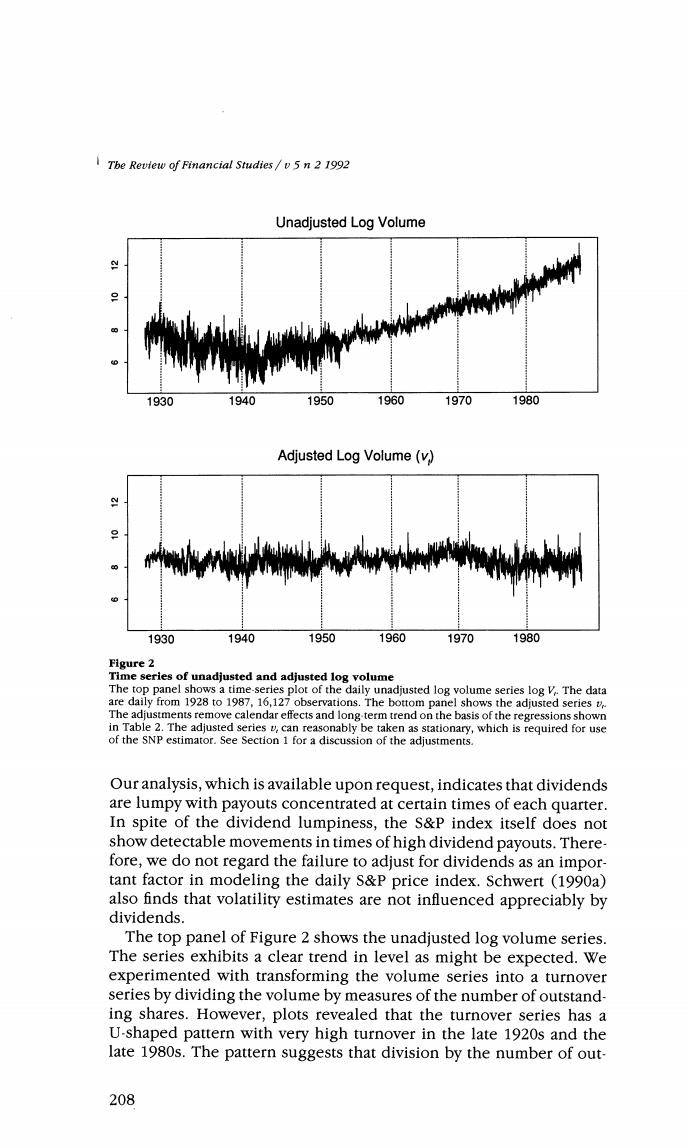
Tbe Review of Financial Studies/v5n 2 1992 Unadjusted Log Volume 1930 1940 1950 1960 1970 1980 Adjusted Log Volume(v) 1930 1940 1950 1960 1970 1980 Figure 2 Time series of unadjusted and adjusted log volume The top panel shows a time-series plot of the daily unadjusted log volume series log V.The data are daily from 1928 to 1987,16,127 observations.The bottom panel shows the adjusted series v The adjustments remove calendar effects and long-term trend on the basis of the regressions shown in Table 2.The adjusted series v,can reasonably be taken as stationary,which is required for use of the SNP estimator.See Section 1 for a discussion of the adjustments. Our analysis,which is available upon request,indicates that dividends are lumpy with payouts concentrated at certain times of each quarter. In spite of the dividend lumpiness,the S&P index itself does not show detectable movements in times of high dividend payouts.There- fore,we do not regard the failure to adjust for dividends as an impor- tant factor in modeling the daily S&P price index.Schwert (1990a) also finds that volatility estimates are not influenced appreciably by dividends. The top panel of Figure 2 shows the unadjusted log volume series. The series exhibits a clear trend in level as might be expected.We experimented with transforming the volume series into a turnover series by dividing the volume by measures of the number of outstand- ing shares.However,plots revealed that the turnover series has a U-shaped pattern with very high turnover in the late 1920s and the late 1980s.The pattern suggests that division by the number of out- 208