正在加载图片...
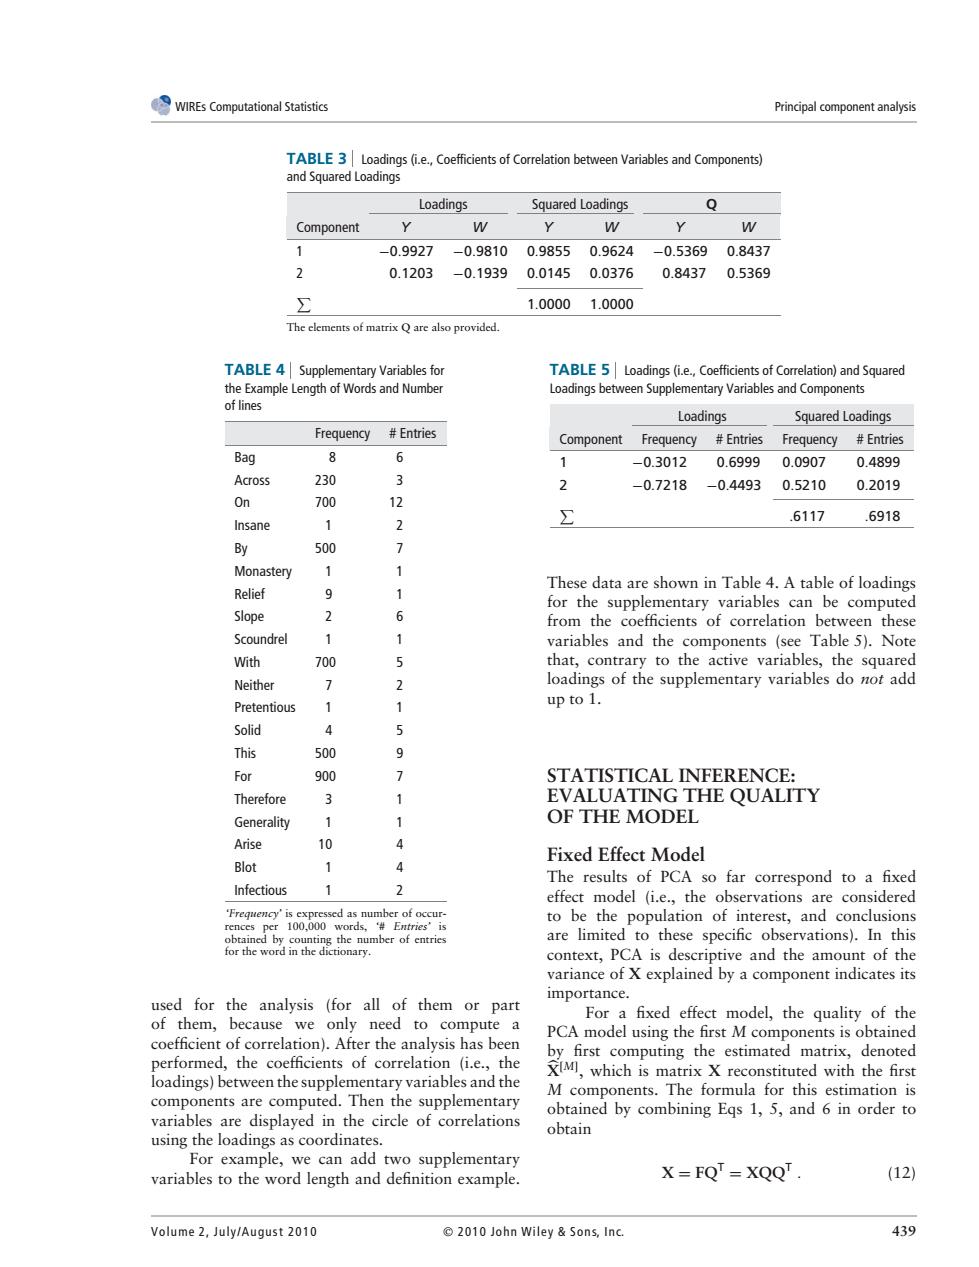
WIREs Computational Statistics Principal component analysis TABLE 3 Loadings (i.e.,Coefficients of Correlation between Variables and Components) and Squared Loadings Loadings Squared Loadings Q Component W W Y W 1 -0.9927 -0.98100.98550.9624 -0.5369 0.8437 2 0.1203 -0.1939 0.0145 0.0376 0.8437 0.5369 ∑ 1.00001.0000 The elements of matrix Q are also provided. TABLE 4 Supplementary Variables for TABLE 5 Loadings(i.e.,Coefficients of Correlation)and Squared the Example Length of Words and Number Loadings between Supplementary Variables and Components of lines Loadings Squared Loadings Frequency #Entries Component Frequency #Entries Frequency #Entries Bag 8 6 1 -0.3012 0.6999 0.0907 0.4899 Across 230 3 2 -0.7218 -0.4493 0.5210 0.2019 On 700 2 6117 6918 Insane 1 2 y 500 7 Monastery 1 These data are shown in Table 4.A table of loadings Relief 9 1 for the supplementary variables can be computed Slope 2 6 from the coefficients of correlation between these Scoundrel variables and the components (see Table 5).Note With 700 5 that,contrary to the active variables,the squared Neither 7 2 loadings of the supplementary variables do not add Pretentious 1 1 up to 1. Solid 4 5 This 500 0 For 900 2 STATISTICAL INFERENCE: Therefore 3 1 EVALUATING THE QUALITY Generality 1 1 OF THE MODEL Arise 10 4 Blot 2 Fixed Effect Model 4 The results of PCA so far correspond to a fixed Infectious 1 2 effect model (i.e.,the observations are considered Frequency'is expressed as number of occur- to be the population of interest,and conclusions rences per 100,000 words,Entries'is obtained by counting the number of entries are limited to these specific observations).In this for the word in the dictionary. context,PCA is descriptive and the amount of the variance of X explained by a component indicates its used for the analysis (for all of them or part importance. of them,because we only need to compute a For a fixed effect model,the quality of the PCA model using the first M components is obtained coefficient of correlation).After the analysis has been by first computing the estimated matrix,denoted performed,the coefficients of correlation (i.e.,the loadings)between the supplementary variables and the XIMI,which is matrix X reconstituted with the first components are computed.Then the supplementary M components.The formula for this estimation is variables are displayed in the circle of correlations obtained by combining Egs 1,5,and 6 in order to obtain using the loadings as coordinates. For example,we can add two supplementary variables to the word length and definition example. X FQT XQQT (12) Volume 2,July/August 2010 2010 John Wiley Sons,Inc 439WIREs Computational Statistics Principal component analysis TABLE 3 Loadings (i.e., Coefficients of Correlation between Variables and Components) and Squared Loadings Loadings Squared Loadings Q Component Y W Y W Y W 1 −0.9927 −0.9810 0.9855 0.9624 −0.5369 0.8437 2 0.1203 −0.1939 0.0145 0.0376 0.8437 0.5369 & 1.0000 1.0000 The elements of matrix Q are also provided. TABLE 4 Supplementary Variables for the Example Length of Words and Number of lines Frequency # Entries Bag 8 6 Across 230 3 On 700 12 Insane 1 2 By 500 7 Monastery 1 1 Relief 9 1 Slope 2 6 Scoundrel 1 1 With 700 5 Neither 7 2 Pretentious 1 1 Solid 4 5 This 500 9 For 900 7 Therefore 3 1 Generality 1 1 Arise 10 4 Blot 1 4 Infectious 1 2 ‘Frequency’ is expressed as number of occurrences per 100,000 words, ‘# Entries’ is obtained by counting the number of entries for the word in the dictionary. used for the analysis (for all of them or part of them, because we only need to compute a coefficient of correlation). After the analysis has been performed, the coefficients of correlation (i.e., the loadings) between the supplementary variables and the components are computed. Then the supplementary variables are displayed in the circle of correlations using the loadings as coordinates. For example, we can add two supplementary variables to the word length and definition example. TABLE 5 Loadings (i.e., Coefficients of Correlation) and Squared Loadings between Supplementary Variables and Components Loadings Squared Loadings Component Frequency # Entries Frequency # Entries 1 −0.3012 0.6999 0.0907 0.4899 2 −0.7218 −0.4493 0.5210 0.2019 & .6117 .6918 These data are shown in Table 4. A table of loadings for the supplementary variables can be computed from the coefficients of correlation between these variables and the components (see Table 5). Note that, contrary to the active variables, the squared loadings of the supplementary variables do not add up to 1. STATISTICAL INFERENCE: EVALUATING THE QUALITY OF THE MODEL Fixed Effect Model The results of PCA so far correspond to a fixed effect model (i.e., the observations are considered to be the population of interest, and conclusions are limited to these specific observations). In this context, PCA is descriptive and the amount of the variance of X explained by a component indicates its importance. For a fixed effect model, the quality of the PCA model using the first M components is obtained by first computing the estimated matrix, denoted X+[M] , which is matrix X reconstituted with the first M components. The formula for this estimation is obtained by combining Eqs 1, 5, and 6 in order to obtain X = FQT = XQQT . (12) Volume 2, July/August 2010 2010 John Wiley & Son s, In c. 439