正在加载图片...
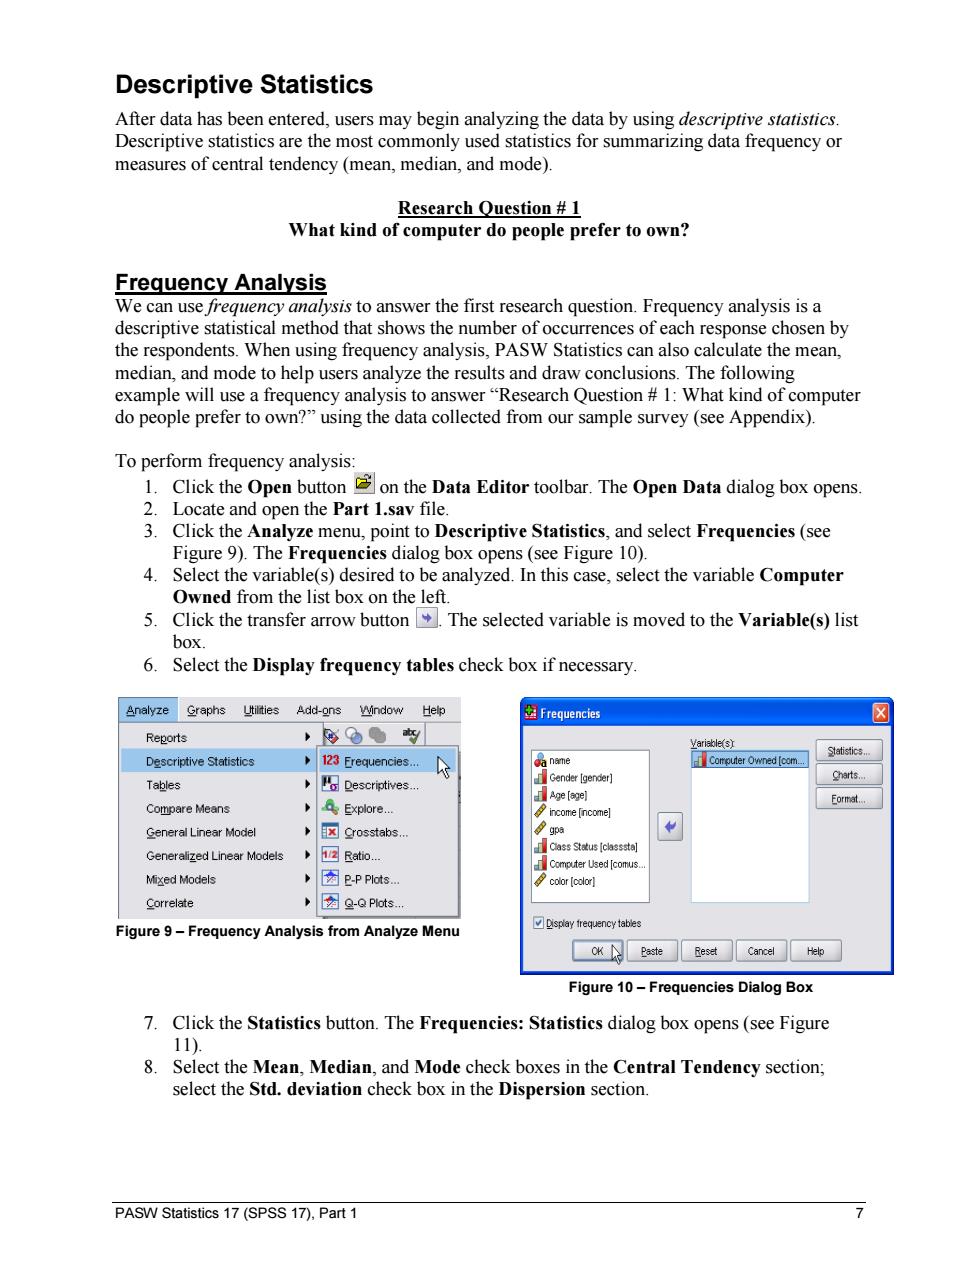
Descriptive Statistics After data has been entered,users may begin analyzing the data by using descriptive statistics. Descriptive statistics are the most commonly used statistics for summarizing data frequency or measures of central tendency(mean,median,and mode). Research Question 1 What kind of computer do people prefer to own? Frequency Analysis We can use frequency analysis to answer the first research question.Frequency analysis is a descriptive statistical method that shows the number of occurrences of each response chosen by the respondents.When using frequency analysis,PASW Statistics can also calculate the mean, median,and mode to help users analyze the results and draw conclusions.The following example will use a frequency analysis to answer "Research Question 1:What kind of computer do people prefer to own?"using the data collected from our sample survey(see Appendix). To perform frequency analysis: 1.Click the Open buttonon the Data Editor toolbar.The Open Data dialog box opens. 2.Locate and open the Part 1.sav file. 3.Click the Analyze menu,point to Descriptive Statistics,and select Frequencies(see Figure 9).The Frequencies dialog box opens (see Figure 10). 4. Select the variable(s)desired to be analyzed.In this case,select the variable Computer Owned from the list box on the left. 5. Click the transfer arrow button.The selected variable is moved to the Variable(s)list box. 6. Select the Display frequency tables check box if necessary. Analyze Graphs Utilities Add-ons Window Help 因Frequencies ☒ Reports ,e● Variable(s】 Statistics Descriptive Statistics 123 Erequencies... A a name Computer Owned [com Descriptives... Gender [gender] Charts... Tables Age [age] Compare Means Explore... Eormat.. income [income] General Linear Model pi☒Crosstabs.n Generalized Linear Models y区Ratio.. Ciass Status [classsta] Computer Used [comus. Mixed Models 图e.PPlots.. 2 color[color】 Correlate 因g-Plots. Figure 9-Frequency Analysis from Analyze Menu Display frequency tables OK Paste Reset Cancel Help Figure 10-Frequencies Dialog Box 7.Click the Statistics button.The Frequencies:Statistics dialog box opens(see Figure 11). 8. Select the Mean,Median,and Mode check boxes in the Central Tendency section; select the Std.deviation check box in the Dispersion section. PASW Statistics 17(SPSS 17).Part 1 7PASW Statistics 17 (SPSS 17), Part 1 7 Descriptive Statistics After data has been entered, users may begin analyzing the data by using descriptive statistics. Descriptive statistics are the most commonly used statistics for summarizing data frequency or measures of central tendency (mean, median, and mode). Research Question # 1 What kind of computer do people prefer to own? Frequency Analysis We can use frequency analysis to answer the first research question. Frequency analysis is a descriptive statistical method that shows the number of occurrences of each response chosen by the respondents. When using frequency analysis, PASW Statistics can also calculate the mean, median, and mode to help users analyze the results and draw conclusions. The following example will use a frequency analysis to answer “Research Question # 1: What kind of computer do people prefer to own?” using the data collected from our sample survey (see Appendix). To perform frequency analysis: 1. Click the Open button on the Data Editor toolbar. The Open Data dialog box opens. 2. Locate and open the Part 1.sav file. 3. Click the Analyze menu, point to Descriptive Statistics, and select Frequencies (see Figure 9). The Frequencies dialog box opens (see Figure 10). 4. Select the variable(s) desired to be analyzed. In this case, select the variable Computer Owned from the list box on the left. 5. Click the transfer arrow button . The selected variable is moved to the Variable(s) list box. 6. Select the Display frequency tables check box if necessary. Figure 9 – Frequency Analysis from Analyze Menu Figure 10 – Frequencies Dialog Box 7. Click the Statistics button. The Frequencies: Statistics dialog box opens (see Figure 11). 8. Select the Mean, Median, and Mode check boxes in the Central Tendency section; select the Std. deviation check box in the Dispersion section