正在加载图片...
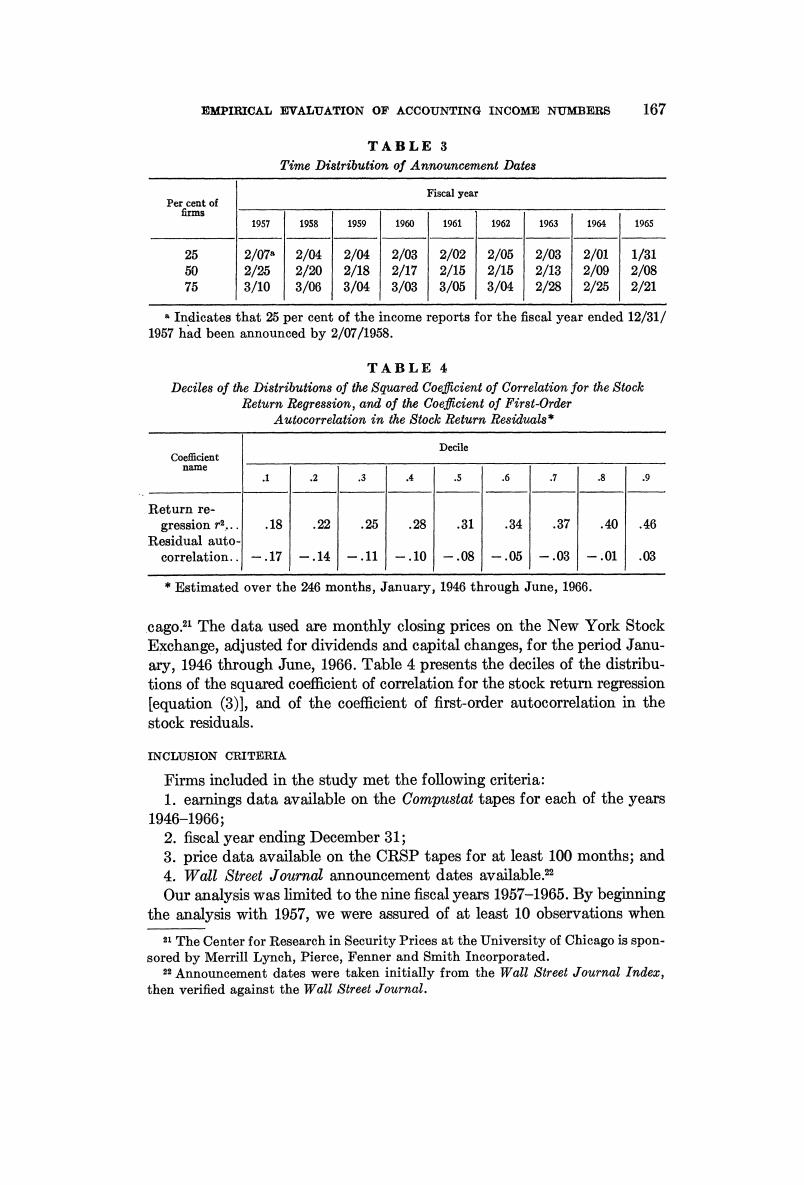
EMPIRICAL EVALUATION OF ACCOUNTING INCOME NUMBERS 167 TABLE 3 Time Distribution of Announcement Dates Fiscal year Per cent of firms 1957 1958 1959 1960 1961 1962 1963 1964 1965 25 2/07 2/04 2/04 2/03 2/02 2/05 2/03 2/01 1/31 2/25 2/20 2/18 2/17 2/15 2/15 2/13 2/09 2/08 的 3/10 3/06 3/04 3/03 3/05 3/04 2/28 2/25 2/21 .Indicates that 25 per cent of the income reports for the fiscal year ended 12/31/ 1957 had been announced by 2/07/1958 TABLE 4 Deciles of the Distributions of the Squared Coefficient of Correlation for the Stock Return Regression,and of the Coeficient of First-Order Autocorrelation in the Stock Return Residuals* Decile name 1 2 3 4 5 .6 7 8 .9 Return re- gression r2.. .18 .22 .25 .28 .31 .34 .37 .40 ,46 Residual auto correlation. -.17 -.14 -,11 -.10 -.08 -.05 -.03 -.01 .03 Estimated over the 246 months,January,1946 through June,1966. cago.2 The data used are monthly closing prices on the New York Stock Exchange,adjusted for dividends and capital changes,for the period Janu- ary,1946 through June,1966.Table 4 presents the deciles of the distribu- tions of the squared coefficient of correlation for the stock return regression lequation (3)],and of the coefficient of first-order autocorrelation in the stock residuals. INCLUSION CRITERIA Firms included in the study met the following criteria: 1.earnings data available on the Compustat tapes for each of the years 1946-1966; 2.fiscal year ending December 31; 3.price data available on the CRSP tapes for at least 100 months;and 4.Wall Street Journal announcement dates available." Our analysis was limited to the nine fiscal years 1957-1965.By beginning the analysis with 1957,we were assured of at least 10 observations when a The Center for Research in Security Prices at the University of Chicago is spon- sored by Merrill Lynch,Pierce,Fenner and Smith Incorporated. Announcement dates were taken initially from the Wall Street Journal Index, then verified against the Wall Street Journal