正在加载图片...
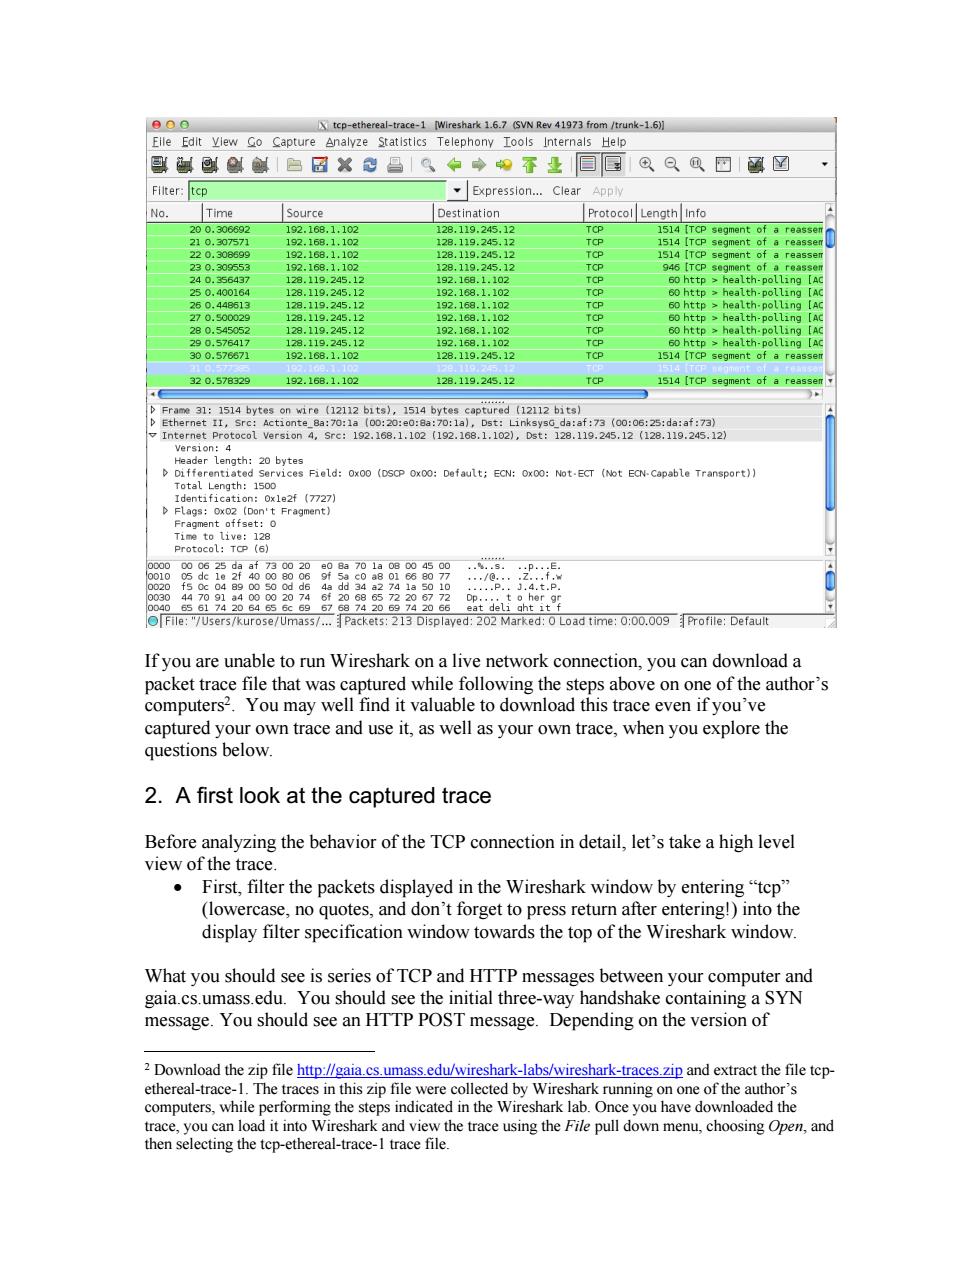
Eile Edit yiew o Capture Analyze Statistics Telephony Iools Internals Help 创创1白☑X旦←中阳苍业回区QQ⑧回函国 ✉Expression..Clear Sourc Protocol Leng 320.57829 192.16,1.102 120.119.245.12 514 [TCP s 1514y d12112b ers/kurose/Umass/..Packets:213 Displayed:202 Marked:Load time::Profie:Default If you unable to run Wireshark on a live network connection,you can download a packet trac e file that was vell find it win ble to do nloa steps ab ove ony e of author" ompu ay w captured own trace and use it,as well as your own trace,when you explore the questions below 2.A first look at the captured trace Before analyzing the behavior of the TCP connection in detail.let's take a high level view of the trace First,filter the packets displayed in the Wireshark window by entering"tcp" (o no orget to pre e display filter specification window towards the top of the Wireshark w window. What you should see is series of TCP and HTTP messages be ween your compute gala.cs.umass.ea You shoul dsee the initial three-way handshake containing a SYN message.You should see an HIIP POSI message.Depending on the version of 2 Download the zin file http//gaia cs umass edw/wireshark-labs/wireshark-traces zin and ext ract the file tep ethereal-trace-1.The traces in this zip file were collected by Wireshark running on one of the author's computers,while steps indicated in the Wireshark lab.On e you have downloaded the -cthereal-ieing wn menu,choosing Open,and If you are unable to run Wireshark on a live network connection, you can download a packet trace file that was captured while following the steps above on one of the author’s computers2. You may well find it valuable to download this trace even if you’ve captured your own trace and use it, as well as your own trace, when you explore the questions below. 2. A first look at the captured trace Before analyzing the behavior of the TCP connection in detail, let’s take a high level view of the trace. • First, filter the packets displayed in the Wireshark window by entering “tcp” (lowercase, no quotes, and don’t forget to press return after entering!) into the display filter specification window towards the top of the Wireshark window. What you should see is series of TCP and HTTP messages between your computer and gaia.cs.umass.edu. You should see the initial three-way handshake containing a SYN message. You should see an HTTP POST message. Depending on the version of 2 Download the zip file http://gaia.cs.umass.edu/wireshark-labs/wireshark-traces.zip and extract the file tcpethereal-trace-1. The traces in this zip file were collected by Wireshark running on one of the author’s computers, while performing the steps indicated in the Wireshark lab. Once you have downloaded the trace, you can load it into Wireshark and view the trace using the File pull down menu, choosing Open, and then selecting the tcp-ethereal-trace-1 trace file