正在加载图片...
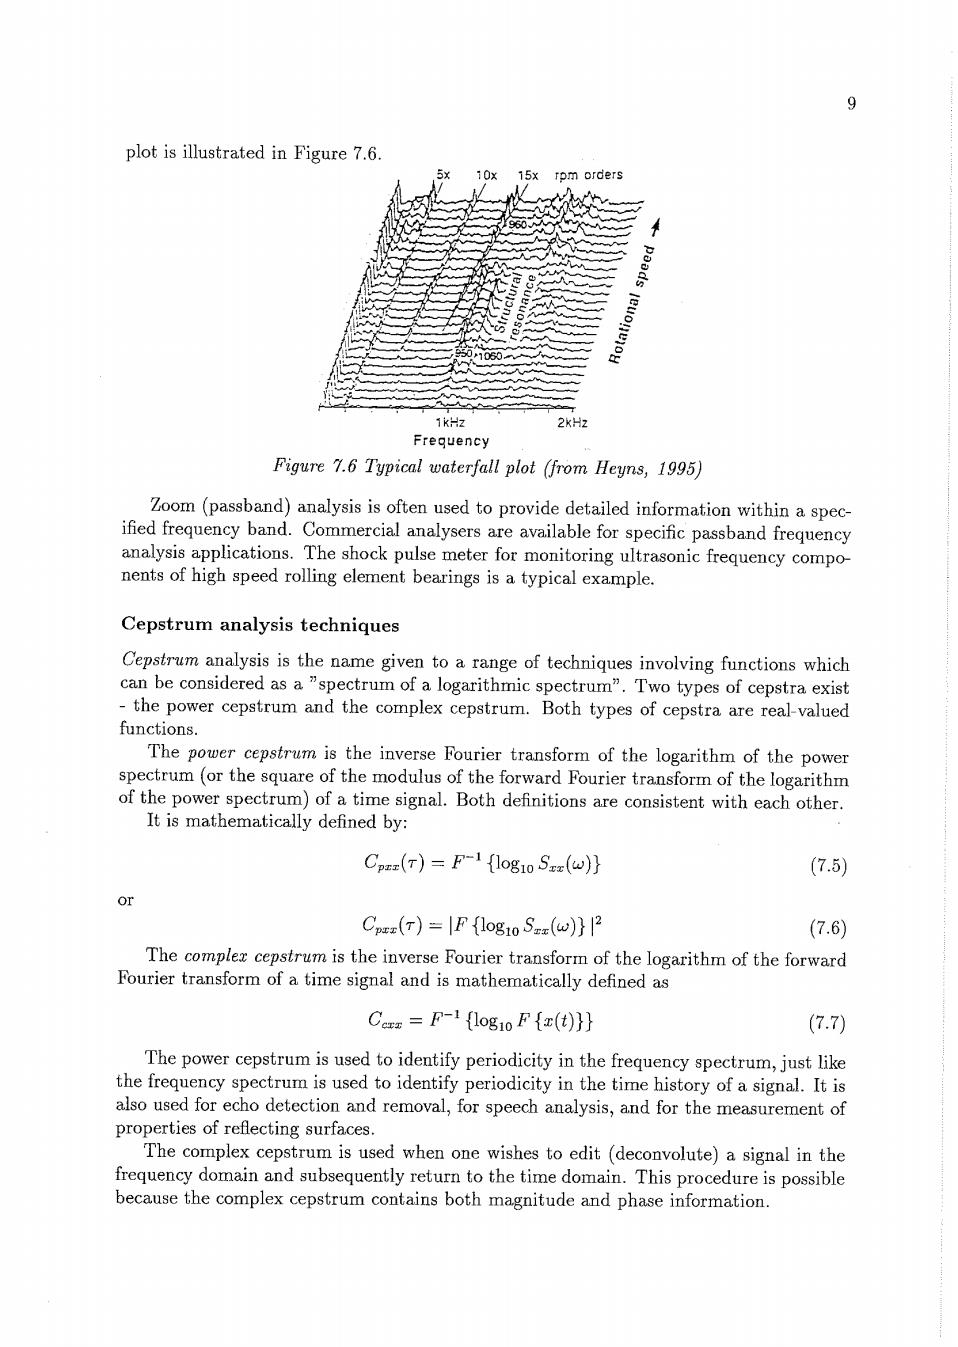
9 plot is illustrated in Figure 7.6. 10x 15x rpm orders 1kHz 2kHz Frequency Figure 7.6 Typical waterfall plot (from Heyns,1995) Zoom(passband)analysis is often used to provide detailed information within a spec- ified frequency band.Commercial analysers are available for specific passband frequency analysis applications.The shock pulse meter for monitoring ultrasonic frequency compo nents of high speed rolling element bearings is a typical example. Cepstrum analysis techniques Cepstrum analysis is the name given to a range of techniques involving functions which can be considered as a "spectrum of a logarithmic spectrum".Two types of cepstra exist the power cepstrum and the complex cepstrum.Both types of cepstra are real-valued functions. The power cepstrum is the inverse Fourier transform of the logarithm of the power spectrum(or the square of the modulus of the forward Fourier transform of the logarithm of the power spectrum)of a time signal.Both definitions are consistent with each other. It is mathematically defined by: Cp(T)=F-1{log1o Sz(w)} (7.5) Or Cp(T)=IF {1og1o S(w)}2 (7.6) The complex cepstrum is the inverse Fourier transform of the logarithm of the forward Fourier transform of a time signal and is mathematically defined as Ce =F-1 {log1o F{(t)}} (7.7) The power cepstrum is used to identify periodicity in the frequency spectrum,just like the frequency spectrum is used to identify periodicity in the time history of a signal.It is also used for echo detection and removal,for speech analysis,and for the measurement of properties of reflecting surfaces. The complex cepstrum is used when one wishes to edit (deconvolute)a signal in the frequency domain and subsequently return to the time domain.This procedure is possible because the complex cepstrum contains both magnitude and phase information