正在加载图片...
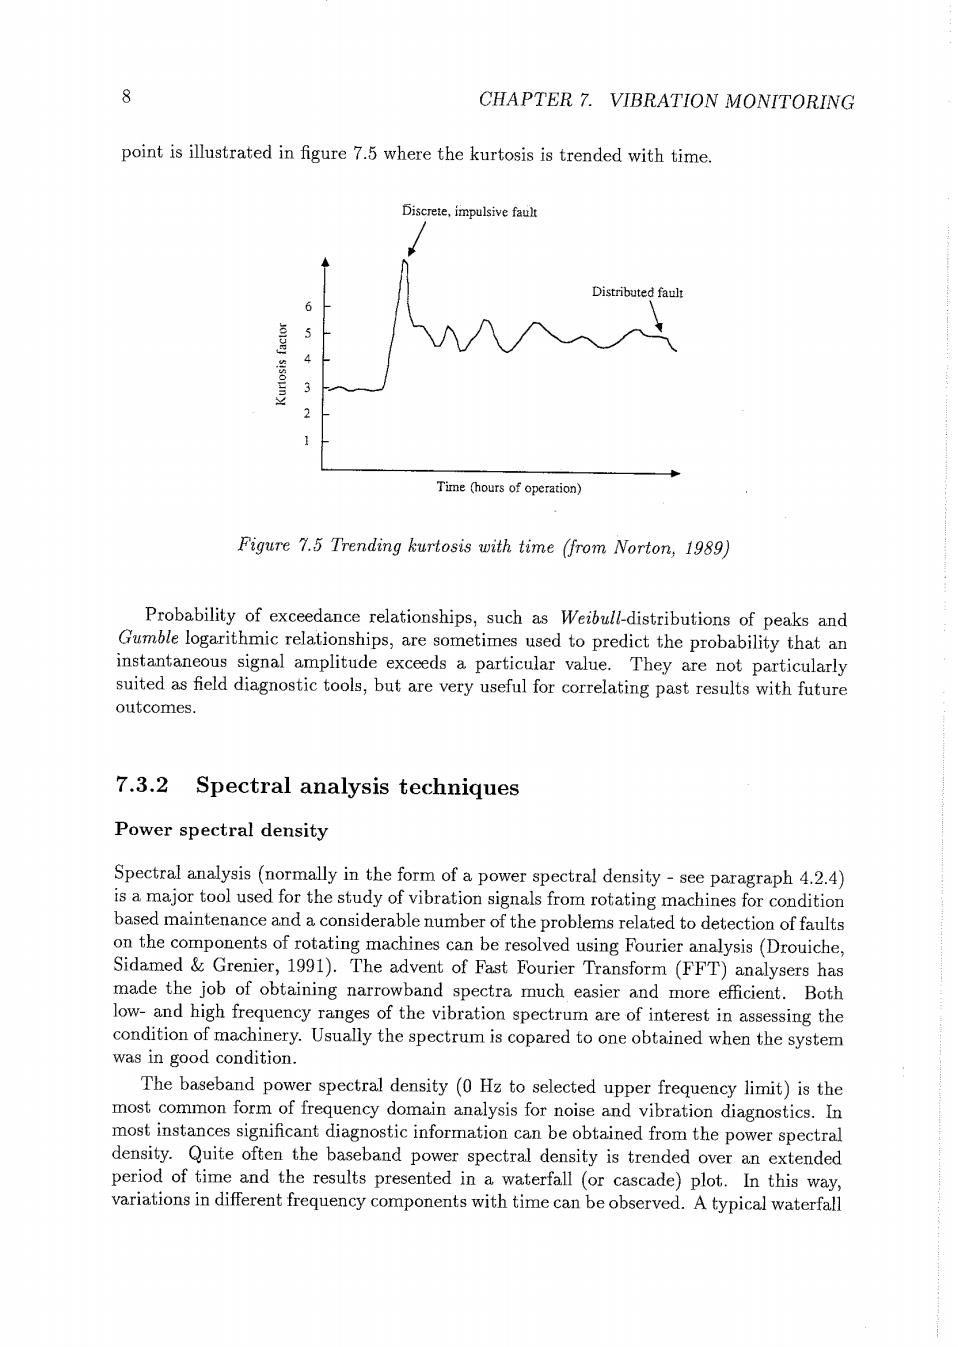
8 CHAPTER 7.VIBRATION MONITORING point is illustrated in figure 7.5 where the kurtosis is trended with time. Discrete,impulsive fault Distributed fault 5 4 Time (hours of operation) Figure 7.5 Trending kurtosis with time (from Norton,1989) Probability of exceedance relationships,such as Weibull-distributions of peaks and Gumble logarithmic relationships,are sometimes used to predict the probability that an instantaneous signal amplitude exceeds a particular value.They are not particularly suited as field diagnostic tools,but are very useful for correlating past results with future outcomes. 7.3.2 Spectral analysis techniques Power spectral density Spectral analysis (normally in the form of a power spectral density-see paragraph 4.2.4) is a major tool used for the study of vibration signals from rotating machines for condition based maintenance and a considerable number of the problems related to detection of faults on the components of rotating machines can be resolved using Fourier analysis(Drouiche, Sidamed Grenier,1991).The advent of Fast Fourier Transform(FFT)analysers has made the job of obtaining narrowband spectra much easier and more efficient.Both low-and high frequency ranges of the vibration spectrum are of interest in assessing the condition of machinery.Usually the spectrum is copared to one obtained when the system was in good condition. The baseband power spectral density(0 Hz to selected upper frequency limit)is the most common form of frequency domain analysis for noise and vibration diagnostics.In most instances significant diagnostic information can be obtained from the power spectral density.Quite often the baseband power spectral density is trended over an extended period of time and the results presented in a waterfall (or cascade)plot.In this way, variations in different frequency components with time can be observed.A typical waterfall