正在加载图片...
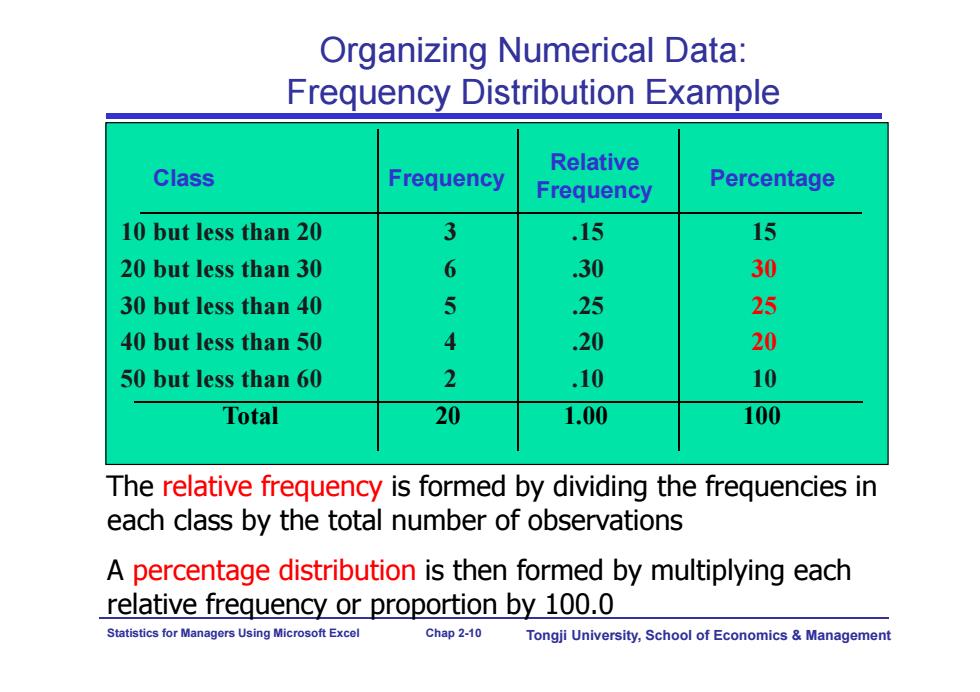
Organizing Numerical Data: Frequency Distribution Example Relative Class Frequency Frequency Percentage 10 but less than 20 3 15 15 20 but less than 30 6 .30 30 30 but less than 40 5 25 25 40 but less than 50 4 .20 20 50 but less than 60 2 .10 10 Total 20 1.00 100 The relative frequency is formed by dividing the frequencies in each class by the total number of observations A percentage distribution is then formed by multiplying each relative frequency or proportion by 100.0 Statistics for Managers Using Microsoft Excel Chap 2-10 Tongji University,School of Economics Management Statistics for Managers Using Microsoft Excel Chap 2-10 Tongji University, School of Economics & Management Class Frequency 10 but less than 20 3 .15 15 20 but less than 30 6 .30 30 30 but less than 40 5 .25 25 40 but less than 50 4 .20 20 50 but less than 60 2 .10 10 Total 20 1.00 100 Relative Frequency Percentage Organizing Numerical Data: Frequency Distribution Example The relative frequency is formed by dividing the frequencies in each class by the total number of observations A percentage distribution is then formed by multiplying each relative frequency or proportion by 100.0