正在加载图片...

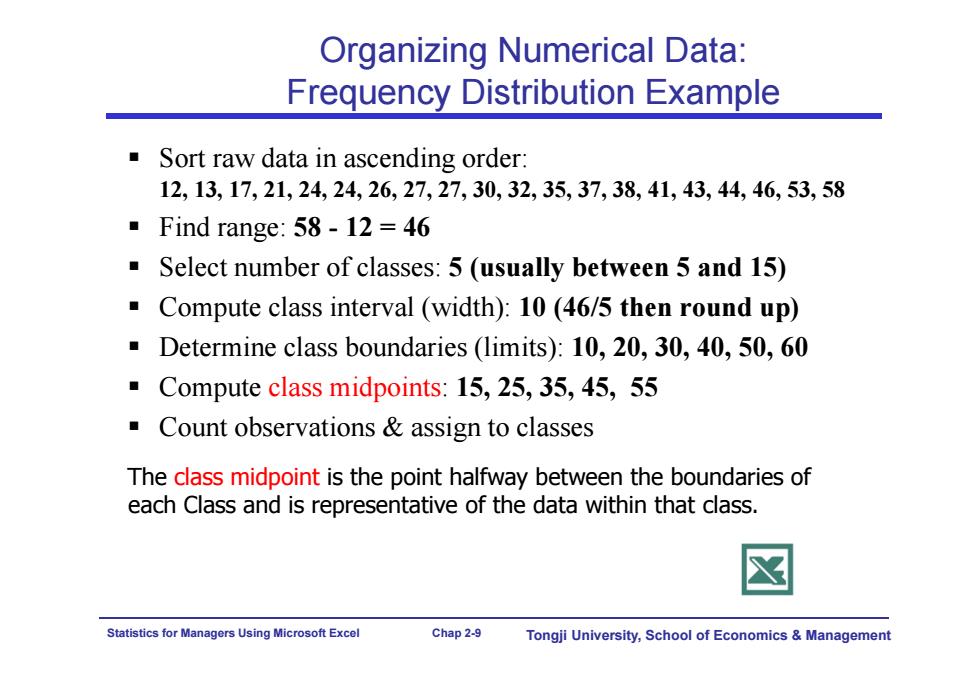
Organizing Numerical Data: Frequency Distribution Example Sort raw data in ascending order: 12,13,17,21,24,24,26,27,27,30,32,35,37,38,41,43,44,46,53,58 ■Find range:58-12=46 Select number of classes:5(usually between 5 and 15) Compute class interval (width):10(46/5 then round up) Determine class boundaries (limits):10,20,30,40,50,60 Compute class midpoints:15,25,35,45,55 Count observations assign to classes The class midpoint is the point halfway between the boundaries of each Class and is representative of the data within that class Statistics for Managers Using Microsoft Excel Chap 2-9 Tongji University,School of Economics ManagementStatistics for Managers Using Microsoft Excel Chap 2-9 Tongji University, School of Economics & Management Organizing Numerical Data: Frequency Distribution Example Sort raw data in ascending order: 12, 13, 17, 21, 24, 24, 26, 27, 27, 30, 32, 35, 37, 38, 41, 43, 44, 46, 53, 58 Find range: 58 - 12 = 46 Select number of classes: 5 (usually between 5 and 15) Compute class interval (width): 10 (46/5 then round up) Determine class boundaries (limits): 10, 20, 30, 40, 50, 60 Compute class midpoints: 15, 25, 35, 45, 55 Count observations & assign to classes The class midpoint is the point halfway between the boundaries of each Class and is representative of the data within that class