正在加载图片...
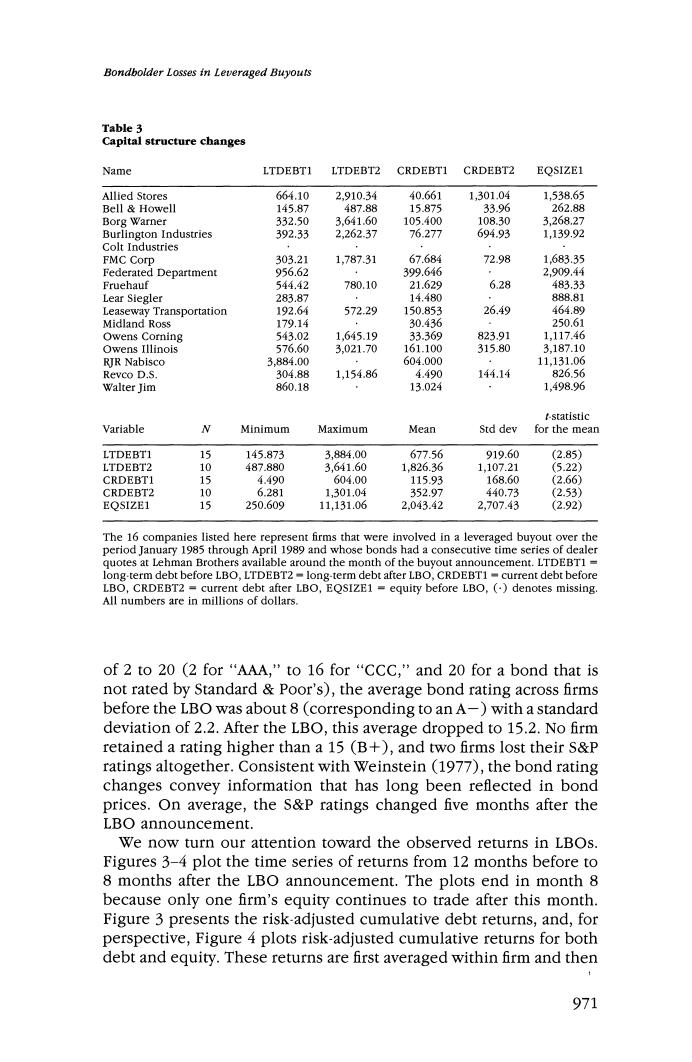
Bondbolder Losses in Leveraged Buyouts Table 3 Capital structure changes Name LTDEBTI LTDEBT2 CRDEBT1 CRDEBT2 EQSIZE1 Allied Stores 664.10 2,910.34 40.661 1,301.04 1,538.65 Bell Howell 145.87 487.88 15.875 33.96 262.88 Borg Warner 332.50 3.641.60 105.400 108.30 3.268.27 Burlington Industries 392.33 2,262.37 76.277 694.93 1,139.92 Colt Industries FMC Corp 303.21 1,787.31 67.684 72.98 1.683.35 Federated Department 956.62 399.646 2909.44 Fruehauf 544.42 780.10 21.629 6.28 483.33 Lear Siegler 283.87 14.480 888.81 Leaseway Transportation 192.64 572.29 150.853 26.49 464.89 Midland Ross 179.14 30.436 250.61 Owens Corning 543.02 1,645.19 33.369 823.91 1,117.46 Owens Illinois 576.60 3.021.70 161.100 315.80 3,187.10 RJR Nabisco 3,884.00 604.000 11,131.06 Revco D.S. 304.88 1,154.86 4.490 144.14 826.56 Walter Jim 860.18 13.024 1,498.96 fstatistic Variable N Minimum Maximum Mean Std dev for the mean LTDEBTI 15 145.873 3,884.00 677.56 919.60 (2.85) LTDEBT2 10 487.880 3,641.60 1,826.36 1.107.21 (5.22) CRDEBT1 15 4.490 604.00 115.93 168.60 (2.66) CRDEBT2 10 6.281 1,301.04 352.97 440.73 (2.53) EQSIZE1 15 250.609 11,131.06 2.043.42 2.707.43 (2.92) The 16 companies listed here represent firms that were involved in a leveraged buyout over the period January 1985 through April 1989 and whose bonds had a consecutive time series of dealer quotes at Lehman Brothers available around the month of the buyout announcement.LTDEBTI= long-term debt before LBO,LTDEBT2-long-term debt after LBO,CRDEBT1 current debt before LBO,CRDEBT2=current debt after LBO,EQSIZE1 equity before LBO,(denotes missing. All numbers are in millions of dollars. of2to20(2for“AAA,”to16for“CCC,”and20 for a bond that is not rated by Standard Poor's),the average bond rating across firms before the LBO was about 8(corresponding to an A-)with a standard deviation of 2.2.After the LBO,this average dropped to 15.2.No firm retained a rating higher than a 15(B+),and two firms lost their S&P ratings altogether.Consistent with Weinstein(1977),the bond rating changes convey information that has long been reflected in bond prices.On average,the S&P ratings changed five months after the LBO announcement. We now turn our attention toward the observed returns in LBOs. Figures 3-4 plot the time series of returns from 12 months before to 8 months after the LBO announcement.The plots end in month 8 because only one firm's equity continues to trade after this month. Figure 3 presents the risk-adjusted cumulative debt returns,and,for perspective,Figure 4 plots risk-adjusted cumulative returns for both debt and equity.These returns are first averaged within firm and then 971