Bondholder Losses in Leveraged Buyouts STOR Arthur Warga;Ivo Welch The Review of Financial Studies,Volume 6,Issue 4 (Winter,1993),959-982. Stable URL: http://links.jstor.org/sici?sici=0893-9454%28199324%296%3A4%3C959%3ABLILB%3E2.0.CO%3B2-R Your use of the JSTOR archive indicates your acceptance of JSTOR's Terms and Conditions of Use,available at http://www.jstor.org/about/terms.html.JSTOR's Terms and Conditions of Use provides,in part,that unless you have obtained prior permission,you may not download an entire issue of a journal or multiple copies of articles,and you may use content in the JSTOR archive only for your personal,non-commercial use. Each copy of any part of a JSTOR transmission must contain the same copyright notice that appears on the screen or printed page of such transmission. The Review of Financial Studies is published by Oxford University Press.Please contact the publisher for further permissions regarding the use of this work.Publisher contact information may be obtained at http://www.jstor.org/journals/oup.html. The Review of Financial Studies 1993 Oxford University Press JSTOR and the JSTOR logo are trademarks of JSTOR,and are Registered in the U.S.Patent and Trademark Office. For more information on JSTOR contact jstor-info@umich.edu. ©2003 JSTOR http://www.jstor.org/ Tue Feb1801:36:112003
Bondholder Losses in Leveraged Buyouts Arthur Warga University of Wisconsin-Milwaukee Ivo Welch University of California,Los Angeles Announcements of successful leveraged buyouts (LBOs)during January 1985 to April 1989 caused a significantly negative return on outstanding publicly traded nonconvertible bonds.Yet the average risk-adjusted debt bolder losses are less than 7 percent of the average risk-adjusted equity bolder gains.Bond losses are related to the pre- LBO rating,but only weakly to equity bolder gains. We demonstrate that trader-quoted data from a major investment bank offers conclusions about the effects of LBOs on debt bolders different from tbose drawn from commonly used matrix and excbange-based data (sucb as Standard Poor's Bond Guide data).Tbis bas important implica- tions for event studies involving debt instruments. The effect of leveraged buyouts (LBOs)on the wealth of target shareholders has received extensive study. We wish to thank an anonymous referee,Ed Altman (a referee),Paul Asquith Bernard Black,Michael Brenan,David Hirshleifer,Gailen Hite,Laurentius Marais,Annette Poulsen,Matthew Spiegel,Richard Sweeney,Sheridan Tit- man,and especially both the Editor Stephen Brown and Managing Editor Chester Spatt for helpful comments.Seminar participants at New York Uni versity,Columbia University,Georgetown University,Loyola University of Chicago,University of Missouri-Columbia,University of North Carolina- Chapel Hill,University of Texas-Austin,Pennsylvania State University,Uni versity of Iowa,University of Wisconsin-Milwaukee,and Rutgers University provided a very helpful sounding board.Advice and assistance in data col- lection were provided by Greg Batey,Ivan Gruhl,Bill Mast,and Walter Rosenblatt at Lehman Brothers.Greg Batey and Emmanuel Roman provided many helpful comments at the early stages of this research.Arthur Warga wishes to thank Howard Clark,Jr.,for his grant supporting this and other research.Address correspondence to Arthur Warga,School of Business Administration,University of Wisconsin-Milwaukee,640 Bolton Hall,Mil- waukee,WI 53201. Tbe Review of Financial Studies Winter 1993 Vol.6,No.4,pp.959-982 1993 The Review of Financial Studies 0893-9454/93/$1.50

Tbe Review of Financial Studies/v 6 n 4 1993 The consensus of past work has been that equity holders receive substantial gains.There is considerably less agreement of the effect of LBOs on the wealth of target bondholders due to the lack of high- quality corporate bond data.By focusing on the issue of bond data sources,we demonstrate that studies that measure the timing and magnitude of security price reaction to recent information (e.g.,LBO announcements)can be sensitive to the type of data that is used.We find that LBOs cause real bondholder losses and that the main effect is concentrated at the time of the LBO announcement. Unfortunately,high-quality bond data are not always available.Most bond trading is carried out in the dealer market where prices are proprietary.Publicly available data,such as that produced by bond trades on the New York Stock Exchange,can be inadequate because these markets are extremely thin.Bond prices from commercial ser. vices that purport to be based on the dealer market are usually tied to an algorithm that does not always incorporate recent information. Although Warga (1991)finds that dealer and exchange-based data sources provide similar prices for large portfolios under normal cir- cumstances,this article shows that high-volume dealer market prices can show important differences in event studies.We find that our dealer market yields react not only sooner than exchange-based yields, but they also show statistically and economically more significant effects.For example,in a current study on LBOs that relies on the s&P bond data,Asquith and Wizman (1990)find an average four- month LBO risk-adjusted announcement bondholder return of-3.2 percent.In contrast,we document equivalent returns of-6.5 to -7.3 percent in the set of overlapping bonds for which the Asquith and Wizman data suggests a-3.8 percent return.Moreover,if we either properly aggregate returns among correlated bonds or if we exclude R.J.R.Nabisco,the S&P data (unlike the trader-quoted data used in this paper)no longer suggest a significant loss of bondholder wealth. Of course,the effect of LBOs on the wealth of bondholders is an interesting issue in its own right and must be addressed to determine the effect of LBOs on total firm value.It has been suggested in aca- demic studies [e.g.,Shleifer and Summers (1988)],as well as in the popular press,that the gains obtained by stockholders may be largely at the expense of bondholders;that is,net firm value may not change significantly.Counter to this argument are claims that improvements in operating efficiency or tax advantages [e.g.,Jensen (1986)]may increase the firm's total value and thus leave bondholders without any losses or,possibly,even with gains. Using exchange data collected from the Wall Street fournal,Lehn and Poulsen (1988)and Marais,Schipper,and Smith (1989)first examined the effect of LBOs on the price performance of outstanding 960

Bondbolder Losses in Leveraged Buyouts senior securities.Lehn and Poulsen find that in the 1980-1984 period, nine publicly traded,nonconvertible bonds issued by eight compa- nies experienced only minimal price changes in the 10-20 day period before and after the leveraged buyout announcements.Marais,Schip- per,and Smith examined price changes around LBO announcements for about 50 publicly traded nonconvertible bonds issued by about 30 firms from 1974 through 1985,and also found that public non- convertible debt experienced only minimal price effects.1 There are two reasons why it is surprising that this earlier literature has found that bondholder prices do not decline in LBOs.First,the bond ratings of firms involved in LBOs are usually significantly down- graded.Second,both Lehn and Poulsen and Marais,Schipper,and Smith reported that leverage ratios triple on average.Higher leverage can reduce the value of outstanding equity both by increasing the probability and the deadweight costs of a possible future bankruptcy and by reordering the priority of claims in bankruptcy.It is well known that if an outstanding bond is not fully protected by seniority cove. nants,an increase in leverage reduces its value.2 Even if a bond has extensive covenants and/or explicit seniority,Franks and Torous (1989)argued that it is unlikely that bankruptcy courts would uphold them.Therefore,even if a bond has priority covenants that prevent the firm from issuing bonds of equal or higher seniority,these priority rules are probably not completely upheld in the case of financial distress.Eberhart,Moore,and Roenfeldt (1990)confirmed this con- jecture.3 They found partial,but far from complete,adherence to priority rules.In their sample of 30 bankruptcy filings,shareholders receive an average of 7.6 percent in excess of that which they would have received under the absolute priority rules in debt covenants. Thus,unless the increase in leverage produces efficiency gains large enough to offset added bankruptcy costs or reduced effective priority, bonds would probably experience negative returns in LBOS.More- over,according to Marais,Schipper,and Smith,Moody's Bond Record indicates widespread rating downgradings but no upgradings of non. convertible debt in their sample,presumably indicating that bond prices should be adversely affected. Altman (1991)provides a comprehensive study of bond downgradings in the 1984-1988 period and finds little negative impact on bond prices in the subset of firms whose downgradings result from event risk (many of which are LBOs appearing in our sample)in a two-month period leading up to the downgrading date.Our conclusion that LBOs cause real bondholder losses may differ not only because we use different data but also because our event date is not the downgrading but the LBO announcement date. 2 For a detailed discussion of bond covenants,see Smith and Warner (1979) 3 A more recent paper by Weiss (1991)also provides evidence of substantial priority violations. Crabbe (1991)documents the introduction of"poison put"covenants into debt issues beginning in 1988 as a response to losses suffered by bondholders in firms undergoing major capital restruc. 961
The Review of Financial Studies /v 6n 4 1993 This article extends past studies of bondholder wealth changes in LBOs in the 1985-1989 period.We use a data set-consisting exclu- sively of trader-quoted prices-that was unavailable in previous stud- ies.In contrast to earlier studies,we find that nonconvertible bond- holders experience significant wealth losses in LBOs.These negative bond price reactions to LBO announcements are significantly related to the ex ante bond rating and time to maturity.Further,although we find some weak evidence that firms with larger debtholder losses experience higher equity holder gains,we do not find that expro- priation of bondholder wealth is a major source of stockholder gains in LBOs,as suggested,for example,in Shleifer and Summers (1988). When we extrapolate the average negative bond price reaction for a company's public nonconvertible debt to the entire debt of the com- pany (long-term debt and debt in current liabilities,as reported in COMPUSTAT),we find that,on average,the total risk-adjusted firm value change is still positive.The debt holder losses can at best account for a small percentage (around 6 percent risk adjusted)of the equity gain.3 We proceed as follows.In Section 1,we discuss and contrast our trader-quoted bond price data to both exchange-based and matrix- based bond price data.Section 2 analyzes both the time series and cross section of bond and equity characteristics and returns,and inves- tigates the hypothesis that equity holders expropriate wealth from bondholders.Section 3 reports results of cross-sectional regressions that test whether pre-LBO announcement bond rating,time to matu- rity,and capital structure contain information about post-LBO bond- holder wealth effects.Section 4 concludes. 1.Bond Pricing Issues 1.1 Available bond data As described in Warga (1991),the acquisition of accurate historical corporate bond price data poses a major challenge for research in this area.The two sources of generally available price quotes are exchange prices (e.g.,New York or American Stock Exchanges)and institutional prices from major over-the-counter bond dealers (e.g., Merril Lynch).Exchange prices reflect primarily the odd-lot activities of individual investors (10 bonds or less per transaction)and cover only a limited number of corporate issues and a negligible portion turings.Crabbe's study measured losses over significantly longer time periods and is not concerned with the timing of the reaction to news of a restructuring. This may not be too surprising,since Altman (1987)documents that even in defaults,bonds lose only 40 percent.Kaplan (1989)documents a 40 percent equity gain in LBOs,and large U.S. companies typically have more equity than debt in their capital structures. 962
Bondbolder Losses in Leveraged Buyouts of the total trading.For example,of the 37 bonds in Lehn and Poulsen, exchange price quotes are available for only 13 bonds by 12 com- panies (9 nonconvertibles,4 convertibles).6 Institutional data is more comprehensive than exchange data.It covers a larger number of bonds,offering prices at which large posi- tions could have been or indeed were transacted.Unfortunately,all studies known to us which use institutional prices use data from the Merrill Lynch Bond Price Service (often obtained indirectly through services such as Data Resources Incorporated or Bloomberg Financial Markets).7 These prices are not trader quotes but algorithmically determined"matrix"prices.The algorithms consist of rules that spec- ify the addition of a fixed spread over either an actively traded bench- mark issue of the same company,another company's issue with similar rating,maturity,and coupon,or a U.S.Treasury issue. Several commercial bond pricing services provide a mix of exchange and matrix prices,and prominent among these are Standard Poor's and Moody's.Both of these services prioritize their data sources by always putting in exchange transactions as the reported prices when they are available.We will henceforth refer to these services as exchange based.Because exchange transactions are rare,exchange- based data services rely heavily on matrix prices.Until recently,matrix prices employed by s&P and Moody's were created by Interactive Data Corporation (IDC).IDC supplies data to S&P and Moody's and, for exchange-listed bonds,fills in missing data with bid prices from the exchange if the nontrading period is less than a week.If a bond does not trade for a week or more,IDC fills in the data series with either an institutionally based matrix bid price or a dealer bid quote. IDC therefore mixes odd-lot exchange data and institutional data in a single series.If a bond is not exchange listed (and most are not), then all prices are matrix based. Figure 1 illustrates a case where transactions-based yields are not available.In October 1986 Lear Siegler announced a leveraged buy. out.S&P provided the yields plotted in Figure 1 in the year surround- ing this event for an 11.75 percent coupon bond maturing October Of the 92 LBOs they studied,68 firms,or nearly three-quarters of their sample,did not have listed bonds outstanding.Moreover,Lehn and Poulsen's largest event window was 20 days before and after the LBO announcement.Their sample would have been further reduced if they had investi- gated post-LBO bond performance more than a month after or before the event (as we do in this article). 7 See Nunn,Hill,and Schneeweis (1986)for references to articles employing institutional prices from Merrill Lynch.Their article also contains additional details on exchange prices. "On rare occasions,IDC will supply an ask price if no bid price is available. According to s&P,matrix prices are now calculated in house for certain issues.During the period covered in this study,IDC was the primary source of matrix prices.Occasionally,IDC uses dealer quotes in its matrix prices,but these dealer quotes represent a small percentage of IDC prices because of the large number of bonds they cover. 963

Tbe Review of Financial Studies/v 6 n 4 1993 12 Lehman Brothers Trader Quoles S&P Bond Guide (Matrix Prices) 9 Govemment/Corporale Index 5】 32-101 Announcement Month (0=October 1986) Figure 1 Yield reaction around Lear Siegler LBO announcement for 11%percent bond of 10/91 The Government/Corporate Index benchmark series combines Lehman Brothers Government and Corporate Bond Indexes.The Corporate Bond Index includes all public,fixed-rate,nonconvertible investment-grade debt.The Government Bond Index includes all U.S.Government guaranteed bonds and notes excluding flower bonds and foreign-targeted issues.Bonds must have a minimum outstanding principal of $25 million and a minimum maturity of one year to quality for any Lehman Brothers bond index. 1991.We collected in-house trader-quoted bid yields from Lehman Brothers (further described in Section B)around this event to match with the s&P yields,and both series are plotted.We also provide the yields to Lehman Brothers'combined Intermediate Term Corporate/ Government Bond Index,which is a commonly used benchmark for gauging bond market performance.Although we are not privy to the exact index or bond that IDC uses to matrix price the Lear Siegler bond,it appears that the bond's matrix-based prices track the Lehman Brothers Corporate/Government Index fairly well.The S&P data exhibit virtually no change around the event,whereas the trader- quoted yields from Lehman Brothers indicate a 200-basis-point increase in yield (and a corresponding decrease in the price Lehman Brothers was willing to pay for the bond).It is the absence of independent movement in the s&P data at the LBO announcement date that sug- gests the prices reported for the bond by s&P (and created by IDC) are just fixed spreads off of some index or more actively traded U.S. Treasury issue. In an article on corporate buyouts,Asquith and Wizman (1990) found that 46 bonds of companies involved in successful LBOs have 964

Bondbolder Losses in Leveraged Buyouts an average risk-adjusted return of -3.2 percent in a fourth-month event window;the subsample of 21 unprotected bonds has an average risk-adjusted return of-3.8 percent.Asquith and Wizman suggested that their event-window drop might be smaller than the risk-adjusted -6 to-7 percent returns reported in here because of differences in sample composition and covenant protection.They argued that Blume, Keim,and Patel (1991)reported that dealer market quotes and data from S&P are broadly consistent,showing a correlation of.92 between prices appearing in the Standard Poor's Guide and Drexel's and Salomon's quoted desk prices for a broad sample of bonds.This is consistent with Warga(1991),whose central result is that,on average, across a broad sample of bonds,pricing portfolios with either dealer or exchange data (actual transactions)produces similar results.(Warga examined investment grade bonds;Blume et al.examined high-yield instruments.) As we demonstrate now,this does not speak to the problems that come up in event studies.To examine if differences in return mag- nitudes are due to differences in the data source,we now compare the LBO event-window returns from the S&P Bond Guide data (used in Asquith and Wizman)with our trader-quoted return data.There are 36 bonds that appear in their sample that are also in the sample we employ here.Our full sample consists of 43 bonds issued by 16 firms (the selection process is detailed later).Since our firms were fairly large and had bonds that were traded frequently at Lehman Brothers,we believe that these bonds are among the most liquid bonds in the Asquith and Wizman sample. Table 1 provides average unadjusted and risk-adjusted event-win- dow returns for the 36 bonds from 13 companies that are common to both Asquith and Wizman (1991)and this study.For valid statistical inference (described with our data and methods),the returns have to be first averaged within firms and then across all firms.10 Our event window is identical to Asquith and Wizman's (1990).Panel A of the table shows that S&P Bond Guide data produces a statistically sig- nificant risk-adjusted event-window drop (of 3.83 percent)only if RJR is included and if different bonds of a company are considered to be independent observations.When either RJR is excluded from the sample (panel B)or bonds of the same company are first properly aggregated (to one bond/firm),the average bond price only drops between 1.70 and 0.93 percent and becomes statistically insignificant. Furthermore,most of the risk-adjusted bond price drops were caused by increases in the risk-adjustment benchmark.Unadjusted S&P returns On the LBO announcement dates,14 of the 36 bonds were exchange-listed (all on the New York Stock Exchange). 965

Tbe Revtew of Financial Studies /v 6n 4 1993 Table 1 Returns from four-month event window for both trader-quote data and s&P bond guide data Trader quote S&P bond guide DTRET DTRETR DTRET DTRETR A:With RJR Nabisco bonds One bond/firm,N=13 Mean -2.75% -6.55% 2.03% -1.70% (-1.06) (-2.78) (1,74) (-1.17) All Bonds,N=36 Mean -4.60% -7.33% -1.10% -3.83% (-3.65) (-5.62) (-1.14) (-3.25) B:Without RJR Nabisco bonds One bond/firm,N=12 Mean -2.32% -6.18% 2.63% -1.14% (-0.84) (-2.44) (2.45) (-0.78) All bonds,N=22 Mean -2.50% -5.00% 1.55% -0.93% (-1.41) (-2.80) (1.38) (-0.62) f-statistics are in parentheses below the coefficients.The 36 bonds from 13 companies examined here represent all bonds traded at Lehman Brothers over the period January 1985 through April 1989 that have both a consecutive time series of dealer quotes available and prices reported in the S&P Bond Guide around the month of the buyout announcement.Risk-adjusted bond returns (DTRETR)are calculated by subtracting from the raw bond return(DTRET)the return of an index with rating and maturity characteristics similar to the bond of interest.The "adjustment"index was constructed from eight Lehman Brothers Corporate Bond indexes by linear interpolation of the two closest indexes in the dimensions of rating and maturity (again,bonds outside the available range of characteristics are benchmarked against the closest index).Under the null hypothesis that LBOs had no effect,the average risk-adjusted debt return should be zero.The event-window returns are calculated from the month-end two months preceding an LBO announcement to the end of the second month following it.For example,if the LBO announcement is March 20,the returns are calculated over February,March,April,and May.One bond/firm means that values are averaged first within firm and then across firms.Trader-quote data are from Lehman Brothers,and exchange-based data are from the S&P Bond Guide. are at best statistically insignificantly negative,at worst statistically significantly positive.In contrast,in this article the risk-adjusted trader- quoted return drops are considerably larger,ranging from 5.00 to 7.30 percent,and always statistically significant.Even unadjusted returns are always negative,ranging from -2.32 to -4.60 percent,although the unadjusted drops are only statistically significant when we include all 36 bonds as independent observations. Panel B of Table 1 presents the same information as panel A but with all 14 RJR bonds excluded from the analysis.Risk-adjusted returns from trader-quote data again reveal significant losses,but none are provided by the S&P data.It is noteworthy that the only significant figure in the s&P data in panel B is a positive unadjusted debt return on a firm-by-firm basis. Note that not all exchange data respond slowly.We can illustrate this with two Federated Department Store bonds that are exchange 966
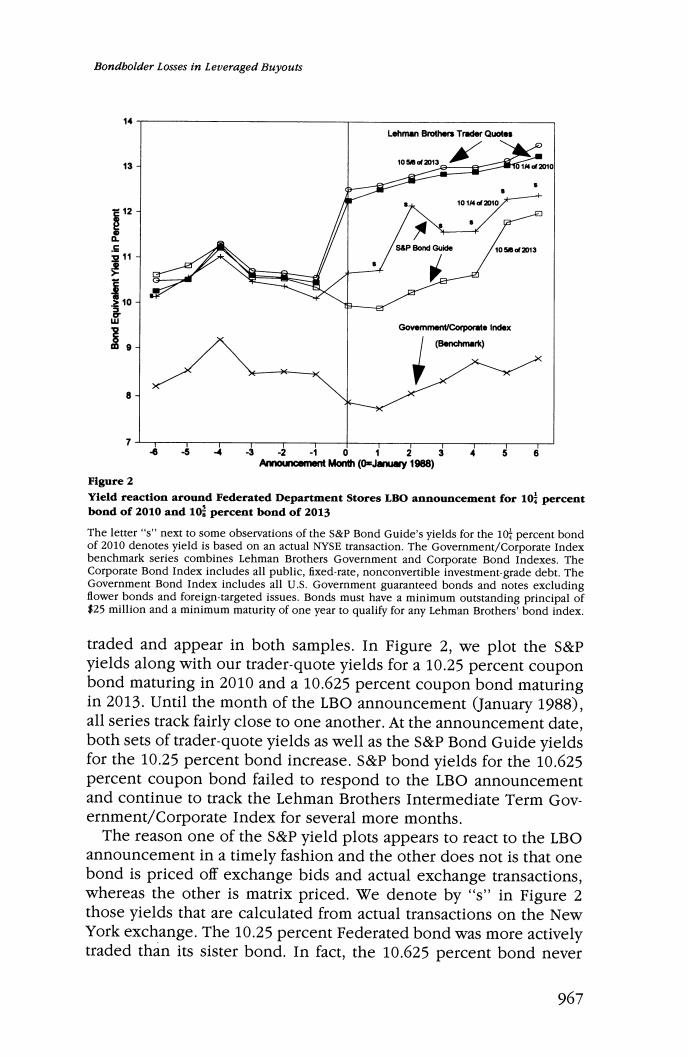
Bondbolder Losses in Leveraged Buyouts 14 Lehman Brothers Trader Quoles 13 102013 12 8d2013 11 Govemment/Corporate Index (Benchmark) 32 0 12345 Announcement Month (0=January 1988) Figure 2 Yield reaction around Federated Department Stores LBO announcement for 10 percent bond of 2010 and 10;percent bond of 2013 The letter"s"next to some observations of the s&P Bond Guide's yields for the 10 percent bond of 2010 denotes yield is based on an actual NYSE transaction.The Government/Corporate Index benchmark series combines Lehman Brothers Government and Corporate Bond Indexes.The Corporate Bond Index includes all public,fixed-rate,nonconvertible investment-grade debt.The Government Bond Index includes all U.S.Government guaranteed bonds and notes excluding flower bonds and foreign-targeted issues.Bonds must have a minimum outstanding principal of $25 million and a minimum maturity of one year to qualify for any Lehman Brothers'bond index. traded and appear in both samples.In Figure 2,we plot the s&P yields along with our trader-quote yields for a 10.25 percent coupon bond maturing in 2010 and a 10.625 percent coupon bond maturing in 2013.Until the month of the LBO announcement (January 1988), all series track fairly close to one another.At the announcement date, both sets of trader-quote yields as well as the s&P Bond Guide yields for the 10.25 percent bond increase.S&P bond yields for the 10.625 percent coupon bond failed to respond to the LBO announcement and continue to track the Lehman Brothers Intermediate Term Gov- ernment/Corporate Index for several more months. The reason one of the S&P yield plots appears to react to the LBO announcement in a timely fashion and the other does not is that one bond is priced off exchange bids and actual exchange transactions, whereas the other is matrix priced.We denote by "s"in Figure 2 those yields that are calculated from actual transactions on the New York exchange.The 10.25 percent Federated bond was more actively traded than its sister bond.In fact,the 10.625 percent bond never 967