Momentum Strategies STOR Louis K.C.Chan;Narasimhan Jegadeesh;Josef Lakonishok The Journal of Finance,Volume 51,Issue 5(Dec.,1996),1681-1713 Stable URL: http:/links.istor.org/sici2sici=0022-1082%28199612%2951%3A5%3C1681%3AMS%3E2.0.C0%3B2-D Your use of the JSTOR archive indicates your acceptance of JSTOR's Terms and Conditions of Use,available at http://www.jstor.org/about/terms.html.JSTOR's Terms and Conditions of Use provides,in part,that unless you have obtained prior permission,you may not download an entire issue of a journal or multiple copies of articles,and you may use content in the JSTOR archive only for your personal,non-commercial use. Each copy of any part of a JSTOR transmission must contain the same copyright notice that appears on the screen or printed page of such transmission. The Journal of Finance is published by American Finance Association.Please contact the publisher for further permissions regarding the use of this work.Publisher contact information may be obtained at http://www.jstor.org/journals/afina.html. The Journal of Finance 1996 American Finance Association JSTOR and the JSTOR logo are trademarks of JSTOR,and are Registered in the U.S.Patent and Trademark Office. For more information on JSTOR contact jstor-info@umich.edu. ©2003 JSTOR http://www.jstor.org/ Tue Feb1801:58:142003
THE JOURNAL OF FINANCE.VOL.LI.NO.5.DECEMBER 1996 Momentum Strategies LOUIS K.C.CHAN,NARASIMHAN JEGADEESH,and JOSEF LAKONISHOK* ABSTRACT We examine whether the predictability of future returns from past returns is due to the market's underreaction to information,in particular to past earnings news.Past return and past earnings surprise each predict large drifts in future returns after controlling for the other.Market risk,size,and book-to-market effects do not explain the drifts.There is little evidence of subsequent reversals in the returns of stocks with high price and earnings momentum.Security analysts'earnings forecasts also respond sluggishly to past news,especially in the case of stocks with the worst past performance.The results suggest a market that responds only gradually to new information. AN EXTENSIVE BODY OF RECENT finance literature documents that the cross- section of stock returns is predictable based on past returns.For example, DeBondt and Thaler(1985,1987)report that long-term past losers outperform long-term past winners over the subsequent three to five years.Jegadeesh (1990)and Lehmann (1990)find short-term return reversals.Jegadeesh and Titman(1993)add a new twist to this literature by documenting that over an intermediate horizon of three to twelve months,past winners on average continue to outperform past losers,so that there is "momentum"in stock prices.Investment strategies that exploit such momentum,by buying past winners and selling past losers,predate the scientific evidence and have been implemented by many professional investors.The popularity of this approach has grown to the extent that momentum investing constitutes a distinct, well-recognized style of investment in the United States and other equity markets. The evidence on return predictability is,as Fama(1991)notes,among the most controversial aspects of the debate on market efficiency.Accordingly,a large number of explanations have been put forward to account for reversals in stock prices.For example,Kaul and Nimalendran (1990)and Jegadeesh and Department of Finance,College of Commerce and Business Administration,University of Illinois at Urbana-Champaign.We thank for their comments Mark Carhart,Eugene Fama(the referee),David Ikenberry,Prem Jain,Charles Jones,Jason Karceski,Tim Loughran,Jay Ritter, Rene Stulz,and an anonymous referee,as well as seminar participants at Arizona State Univer- sity,1996 Berkeley Program in Finance,the Chicago Quantitative Alliance Third Annual Confer- ence,the Institute for International Research Conference on Behavioral Finance,the NBER Summer 1995 Institute on Asset Pricing,the Second Annual Conference on the Psychology of Investing,the University of Illinois,the University of Southern California,the University of Toronto and Yale University.We also thank Qiong Zhang for research assistance.Partial com- puting support was provided by the National Center for Supercomputing Applications,University of Illinois at Urbana-Champaign. 1681
1682 The Journal of Finance Titman(1995)examine whether bid-ask spreads can explain short-term re- versals.Short-term contrarian profits may also be due to lead-lag effects between stocks(Lo and MacKinlay (1990)).DeBondt and Thaler(1985,1987), and Chopra,Lakonishok,and Ritter(1992)point to investors'tendencies to overreact.Competing explanations for long-term reversals are based on mi- crostructure biases that are particularly serious for low-priced stocks (Ball, Kothari,and Shanken (1995),Conrad and Kaul(1993)),or time-variation in expected returns(Ball and Kothari (1989)).Since differences across stocks in their past price performance tend to show up as differences in their book-to- market value of equity and in related measures as well,the phenomenon of long-term reversals is related to the kinds of book-to-market effects discussed by Chan,Hamao,and Lakonishok (1991),Fama and French (1992),and Lakonishok,Shleifer,and Vishny (1994). The situation with respect to stock price momentum is very different.In contrast to the rich array of testable hypotheses concerning long-and short- term reversals,there is a woeful shortage of potential explanations for mo- mentum.A recent article by Fama and French (1996)tries to rationalize a number of related empirical regularities,but fails to account for the profitabil- ity of the Jegadeesh and Titman (1993)strategies.In the absence of an explanation,the evidence on momentum stands out as a major unresolved puzzle.From the standpoint of investors,this state of affairs should also be a source of concern.The lack of an explanation suggests that there is a good chance that a momentum strategy will not work out-of-sample and is merely a statistical fluke. The objective of this article is to trace the sources of the predictability of future stock returns based on past returns.It is natural to look to earnings to try to understand movements in stock prices,so we explore this avenue to rationalize the existence of momentum.In particular,this article relates the evidence on momentum in stock prices to the evidence on the market's under- reaction to earnings-related information.For instance,Latane and Jones (1979),Bernard and Thomas (1989),and Bernard,Thomas,and Wahlen (1995),among others,find that firms reporting unexpectedly high earnings outperform firms reporting unexpectedly poor earnings.The superior perfor- mance persists over a period of about six months after earnings announce- ments.Givoly and Lakonishok(1979)report similar sluggishness in the re- sponse of prices to revisions in analysts'forecasts of earnings.Accordingly,one possibility is that the profitability of momentum strategies is entirely due to the component of medium-horizon returns that is related to these earnings- related news.If this explanation is true,then momentum strategies will not be profitable after accounting for past innovations in earnings and earnings forecasts.Affleck-Graves and Mendenhall (1992)examine the Value Line timeliness ranking system(a proprietary model based on a combination of past earnings and price momentum,among other variables),and suggest that earnings surprises account for Value Line's ability to predict future returns. Another possibility is that the profitability of momentum strategies stems from overreaction induced by positive feedback trading strategies of the sort
Momentum Strategies 1683 discussed by DeLong,Shleifer,Summers,and Waldmann(1990).This expla- nation implies that "trend-chasers"reinforce movements in stock prices even in the absence of fundamental information,so that the returns for past win- ners and losers are (at least partly)temporary in nature.Under this explana- tion,we expect that past winners and losers will subsequently experience reversals in their stock prices. Finally,it is possible that strategies based either on past returns or on earnings surprises(we refer to the latter as "earnings momentum"strategies) exploit market under-reaction to different pieces of information.For example, an earnings momentum strategy may benefit from underreaction to informa- tion related to short-term earnings,while a price momentum strategy may benefit from the market's slow response to a broader set of information, including longer-term profitability.In this case we would expect that each of the momentum strategies is individually successful,and that one effect is not subsumed by the other.True economic earnings are imperfectly measured by accounting numbers,so reported earnings may be currently low even though the firm's prospects are improving.If the stock price incorporates other sources of information about future profitability,then there may be momentum in stock prices even with weak reported earnings. In addition to relating the evidence on price momentum to that on earnings momentum,this article adds to the existing literature in several ways.We provide a comprehensive analysis of different earnings momentum strategies on a common set of data.These strategies differ with respect to how earnings surprises are measured and each adds a different perspective.In the finance literature,the most common way of measuring earnings surprises is in terms of standardized unexpected earnings,although this variable requires a model of expected earnings and hence runs the risk of specification error.In compar- ison,analysts'forecasts of earnings have not been as widely used in the finance literature,even though they provide a more direct measure of expectations and are available on a more timely basis.Tracking changes in analysts'forecasts is also a popular technique used by investment managers.The abnormal returns surrounding earnings announcements provide another means of objectively capturing the market's interpretation of earnings news.A particularly intrigu- ing puzzle in this regard is that Foster,Olsen,and Shevlin (1984)find that while standardized unexpected earnings help to predict future returns,resid- ual returns immediately around the announcement date have no such power. Our analysis helps to clear up some of these lingering issues on earnings momentum.We go on to confront the performance of price momentum with earnings momentum strategies,using portfolios formed on the basis of one- way,as well as two-way,classifications.These comparisons,and our cross- sectional regressions,help to disentangle the relative predictive power of past returns and earnings surprises for future returns.We also provide evidence on the risk-adjusted performance of the price and earnings momentum strategies. We confirm that drifts in future returns over the next six and twelve months are predictable from a stock's prior return and from prior news about earnings. Each momentum variable has separate explanatory power for future returns
1684 The Journal of Finance so one strategy does not subsume the other.There is little sign of subsequent reversals in returns,suggesting that positive feedback trading cannot account for the profitability of momentum strategies.If anything,the returns for companies that are ranked lowest by past earnings surprise are persistently below average in the following two to three years.Security analysts'forecasts of earnings are also slow to incorporate past earnings news,especially for firms with the worst past earnings performance.The bulk of the evidence thus points to a delayed reaction of stock prices to the information in past returns and in past earnings. The remainder of the article is organized as follows.Section I describes the sample and our methodology.Univariate analyses of our different momentum strategies are carried out in Section II,while the results from multivariate analyses are reported in Section III.Section IV examines whether price and earnings momentum are subsequently corrected.Section V checks that our results are robust by replicating the results for larger companies only,and by controlling for risk factors.Section VI concludes. I.Sample and Methodology We consider all domestic,primary stocks listed on the New York (NYSE), American (AMEX),and Nasdag stock markets.Closed-end funds,Real Estate Investment Trusts(REITs),trusts,American Depository Receipts(ADRs),and foreign stocks are excluded from the analysis.Since we require information on earnings,the sample comprises all companies with coverage on both the Center for Research in Security Prices(CRSP)and COMPUSTAT(Active and Research)files.The data for firms in this sample are supplemented,wherever available,with data on analysts'forecasts of earnings from the Lynch,Jones, and Ryan Institutional Brokers Estimate System (I/B/E/S)database. At the beginning of every month from January 1977 to January 1993,we rank stocks on the basis of either past returns or a measure of earnings news. To be eligible,a stock need only have data available on the variable(s)used for ranking,even though we provide information on other stock attributes.The ranked stocks are then assigned to one of ten decile portfolios,where the breakpoints are based only on NYSE stocks.In our earnings momentum strategies,the breakpoints in any given month are based on all NYSE firms that have reported earnings within the prior three months.This takes into account a complete cycle of earnings announcements.All stocks are equally- weighted within a given portfolio. The ranking variable used in our price momentum strategy is a stock's past compound return,extending back six months prior to portfolio formation.In our earnings momentum strategies,we use three different measures of earn- ings news.Our first is the commonly used standardized unexpected earnings (SUE)variable.Foster,Olsen,and Shevlin (1984)examine different time series models for expected earnings and how the resulting measures of unan- ticipated earnings are associated with future returns.They find that a sea- sonal random walk model performs as well as more complex models,so we use
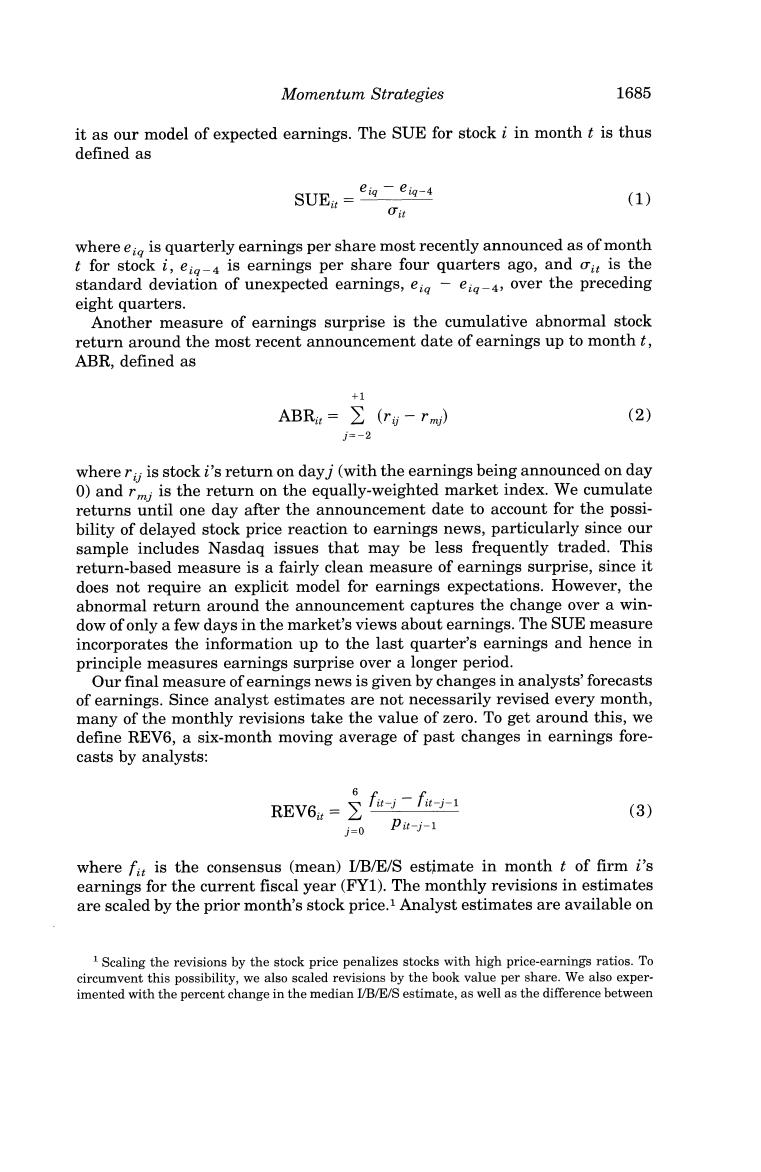
Momentum Strategies 1685 it as our model of expected earnings.The SUE for stock i in month t is thus defined as SUEn=eiae- (1) Gi where eig is quarterly earnings per share most recently announced as of month t for stock i,ei-4 is earnings per share four quarters ago,and oit is the standard deviation of unexpected earnings,eig-eig-4,over the preceding eight quarters. Another measure of earnings surprise is the cumulative abnormal stock return around the most recent announcement date of earnings up to month t, ABR,defined as +1 ABRa=∑(ri-rm) (2) j=-2 where ri;is stock i's return on day j(with the earnings being announced on day 0)and rmj is the return on the equally-weighted market index.We cumulate returns until one day after the announcement date to account for the possi- bility of delayed stock price reaction to earnings news,particularly since our sample includes Nasdaq issues that may be less frequently traded.This return-based measure is a fairly clean measure of earnings surprise,since it does not require an explicit model for earnings expectations.However,the abnormal return around the announcement captures the change over a win- dow of only a few days in the market's views about earnings.The SUE measure incorporates the information up to the last quarter's earnings and hence in principle measures earnings surprise over a longer period. Our final measure of earnings news is given by changes in analysts'forecasts of earnings.Since analyst estimates are not necessarily revised every month, many of the monthly revisions take the value of zero.To get around this,we define REV6,a six-month moving average of past changes in earnings fore- casts by analysts: REv6u=∑f-f 6 (3) j=0P-j-1 where fit is the consensus (mean)I/B/E/S estimate in month t of firm i's earnings for the current fiscal year(FY1).The monthly revisions in estimates are scaled by the prior month's stock price.1 Analyst estimates are available on 1 Scaling the revisions by the stock price penalizes stocks with high price-earnings ratios.To circumvent this possibility,we also scaled revisions by the book value per share.We also exper- imented with the percent change in the median I/B/E/S estimate,as well as the difference between
1686 The Journal of Finance a monthly basis2 and dispense with the need for a model of expected earnings. However,the estimates issued by analysts may be colored by other incentives such as the desire to encourage investors to trade and hence generate broker- age commissions.3 As a result,analyst forecasts may not be a clean measure of expected earnings. For each of our momentum strategies,we report buy-and-hold returns in the periods subsequent to portfolio formation.Returns measured over contiguous intervals may be spuriously related due to bid-ask bounce,thereby attenuating the performance of the price momentum strategy.To control for this effect,we skip the first five days after portfolio formation before we begin to measure returns under the price momentum strategy and,for the sake of comparability, under the earnings momentum strategy as well.If a stock is delisted after it is included in a portfolio but before the end of the holding period over which returns are calculated,we replace its return until the end of the period with the return on a value-weighted market index.At the end of the period we rebalance all the remaining stocks in the original portfolio to equal weights in order to calculate returns in subsequent periods.In addition to returns on the portfolios,we also report two attributes of our portfolios-the book-to-market value of equity and the ratio of cash flow (earnings plus depreciation)to price-at the time of portfolio formation.Finally,we also track our three measures of earnings surprise(SUE,ABR,and REV6)at the time of portfolio formation and thereafter. II.Price and Earnings Momentum:Univariate Analysis A.Price Momentum We first examine the ability of each of the momentum strategies to predict future returns,and the characteristics of the momentum portfolios.To lay the groundwork,Table I reports correlations between the various measures we use to group stocks into portfolios.The correlations are based on monthly obser- vations pooled across all stocks.Although the variables are positively corre- lated with one another,the coefficients are not large.In particular,the differ- the number of upward and downward revisions as a proportion of the number of estimates.Our results are robust to these alternative measures of analyst revisions. 2 In the context of an implementable investment strategy,all stocks are candidates for inclusion in our price momentum or earnings momentum portfolios in a given month.The strategy based on analyst revisions automatically fulfills this requirement,since consensus estimates are available at a monthly frequency.The portfolios based on standardized unexpected earnings and abnormal announcement returns will pick up an earnings variable that may be somewhat out-of-date for those firms not announcing earnings in the month of portfolio formation.This may lead to an understatement of the returns to these two earnings momentum strategies,but in any event we are able to compare directly the results from the price momentum and from the earnings momen- tum strategies. 3 Several recent examples of these kinds of pressures on analysts are described by Michael Siconolfi in "A rare glimpse at how Wall Street covers clients,"Wall Street Journal,July 14,1995, and "Incredible buys:Many companies press analysts to steer clear of negative ratings,"Wall Street Journal,July 19,1995
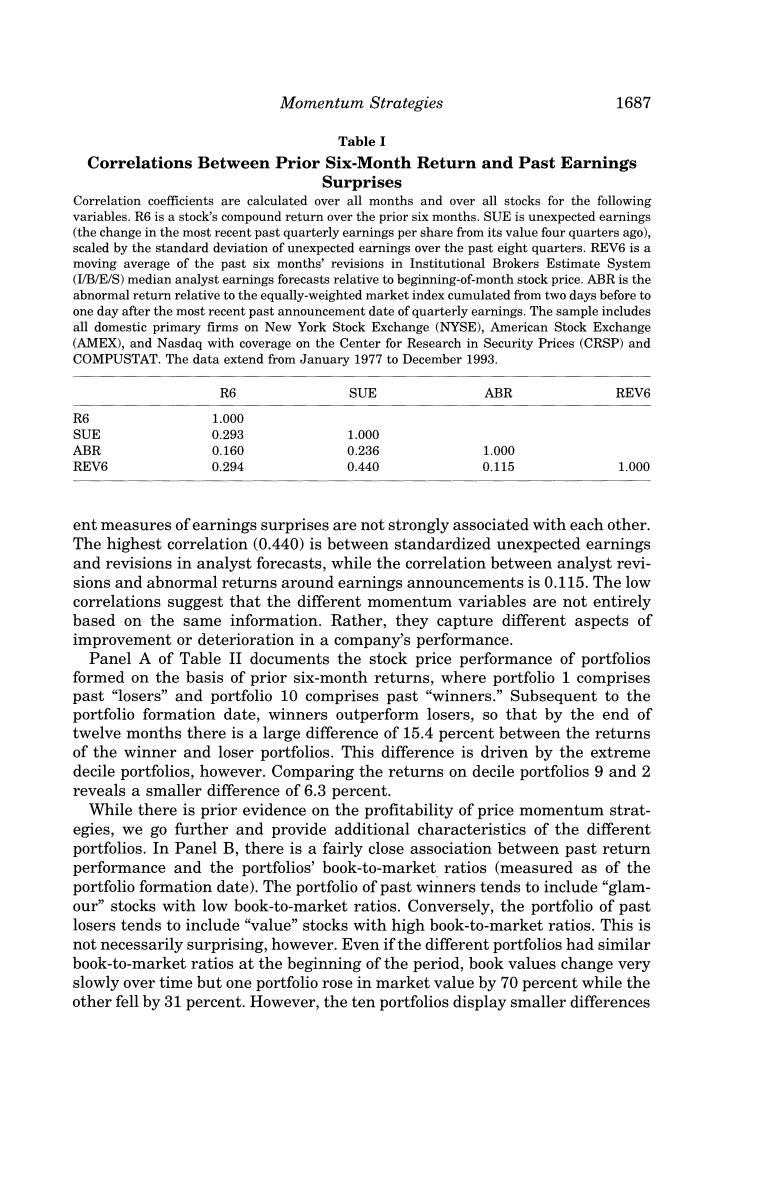
Momentum strategies 1687 Table I Correlations Between Prior Six-Month Return and Past Earnings Surprises Correlation coefficients are calculated over all months and over all stocks for the following variables.R6 is a stock's compound return over the prior six months.SUE is unexpected earnings (the change in the most recent past quarterly earnings per share from its value four quarters ago), scaled by the standard deviation of unexpected earnings over the past eight quarters.REV6 is a moving average of the past six months'revisions in Institutional Brokers Estimate System (I/B/E/S)median analyst earnings forecasts relative to beginning-of-month stock price.ABR is the abnormal return relative to the equally-weighted market index cumulated from two days before to one day after the most recent past announcement date of quarterly earnings.The sample includes all domestic primary firms on New York Stock Exchange (NYSE),American Stock Exchange (AMEX),and Nasdaq with coverage on the Center for Research in Security Prices (CRSP)and COMPUSTAT.The data extend from January 1977 to December 1993. R6 SUE ABR REV6 R6 1.000 SUE 0.293 1.000 ABR 0.160 0.236 1.000 REV6 0.294 0.440 0.115 1.000 ent measures of earnings surprises are not strongly associated with each other. The highest correlation(0.440)is between standardized unexpected earnings and revisions in analyst forecasts,while the correlation between analyst revi- sions and abnormal returns around earnings announcements is 0.115.The low correlations suggest that the different momentum variables are not entirely based on the same information.Rather,they capture different aspects of improvement or deterioration in a company's performance. Panel A of Table II documents the stock price performance of portfolios formed on the basis of prior six-month returns,where portfolio 1 comprises past "losers"and portfolio 10 comprises past "winners."Subsequent to the portfolio formation date,winners outperform losers,so that by the end of twelve months there is a large difference of 15.4 percent between the returns of the winner and loser portfolios.This difference is driven by the extreme decile portfolios,however.Comparing the returns on decile portfolios 9 and 2 reveals a smaller difference of 6.3 percent. While there is prior evidence on the profitability of price momentum strat- egies,we go further and provide additional characteristics of the different portfolios.In Panel B,there is a fairly close association between past return performance and the portfolios'book-to-market ratios (measured as of the portfolio formation date).The portfolio of past winners tends to include"glam- our"stocks with low book-to-market ratios.Conversely,the portfolio of past losers tends to include "value"stocks with high book-to-market ratios.This is not necessarily surprising,however.Even if the different portfolios had similar book-to-market ratios at the beginning of the period,book values change very slowly over time but one portfolio rose in market value by 70 percent while the other fell by 31 percent.However,the ten portfolios display smaller differences
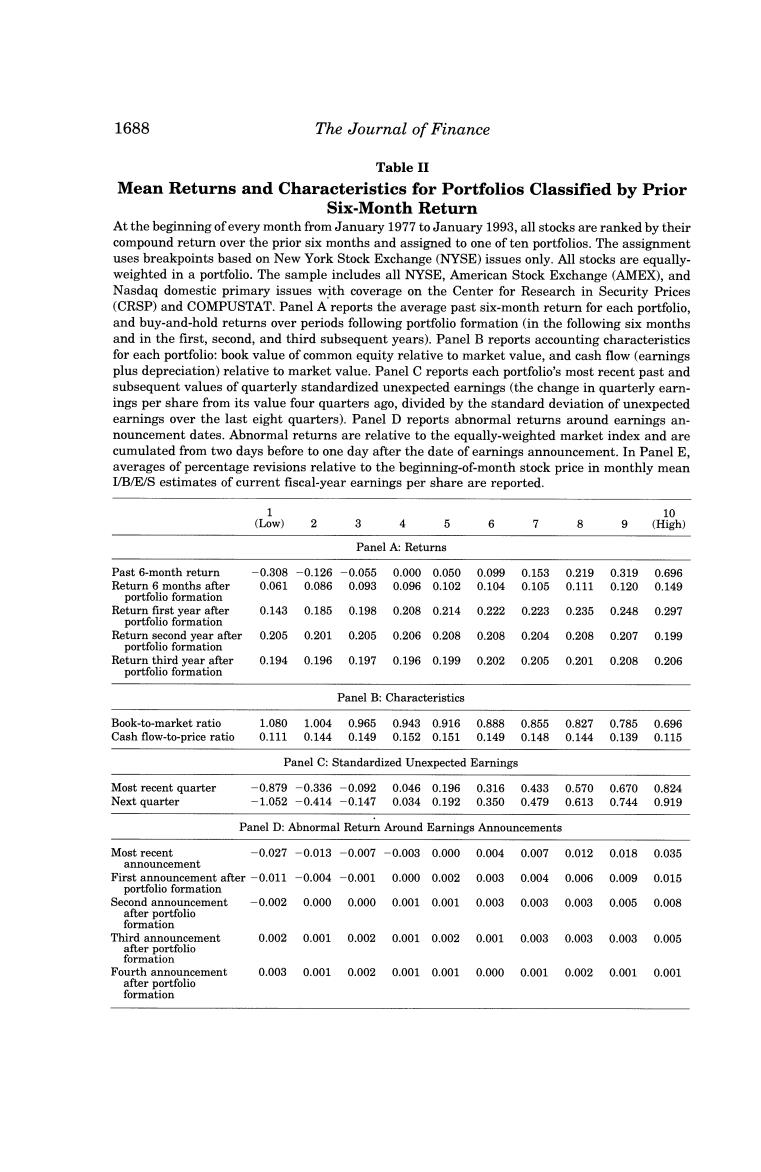
1688 The Journal of Finance Table II Mean Returns and Characteristics for Portfolios Classified by Prior Six-Month Return At the beginning of every month from January 1977 to January 1993,all stocks are ranked by their compound return over the prior six months and assigned to one of ten portfolios.The assignment uses breakpoints based on New York Stock Exchange (NYSE)issues only.All stocks are equally- weighted in a portfolio.The sample includes all NYSE,American Stock Exchange (AMEX),and Nasdaq domestic primary issues with coverage on the Center for Research in Security Prices (CRSP)and COMPUSTAT.Panel A reports the average past six-month return for each portfolio, and buy-and-hold returns over periods following portfolio formation(in the following six months and in the first,second,and third subsequent years).Panel B reports accounting characteristics for each portfolio:book value of common equity relative to market value,and cash flow (earnings plus depreciation)relative to market value.Panel C reports each portfolio's most recent past and subsequent values of quarterly standardized unexpected earnings(the change in quarterly earn- ings per share from its value four quarters ago,divided by the standard deviation of unexpected earnings over the last eight quarters).Panel D reports abnormal returns around earnings an- nouncement dates.Abnormal returns are relative to the equally-weighted market index and are cumulated from two days before to one day after the date of earnings announcement.In Panel E, averages of percentage revisions relative to the beginning-of-month stock price in monthly mean I/B/E/S estimates of current fiscal-year earnings per share are reported. 1 10 (L0w) 3 6 7 9 (High) Panel A:Returns Past 6-month return -0.308-0.126-0.0550.0000.0500.0990.153 0.2190.319 0.696 Return 6 months after 0.061 0.0860.093 0.0960.1020.1040.105 0.1110.120 0.149 portfolio formation Return first year after 0.143 0.1850.198 0.2080.2140.2220.223 0.2350.248 0.297 portfolio formation Return second year after 0.205 0.2010.2050.2060.2080.2080.204 0.2080.207 0.199 portfolio formation Return third year after 0.194 0.1960.197 0.1960.1990.2020.205 0.2010.208 0.206 portfolio formation Panel B:Characteristics Book-to-market ratio 1.080 1.004 0.9650.9430.9160.888 0.8550.8270.785 0.696 Cash flow-to-price ratio 0.111 0.144 0.149 0.1520.1510.149 0.1480.1440.139 0.115 Panel C:Standardized Unexpected Earnings Most recent quarter -0.879-0.336-0.092 0.0460.1960.3160.433 0.5700.670 0.824 Next quarter -1.052-0.414-0.147 0.0340.1920.3500.479 0.6130.744 0.919 Panel D:Abnormal Return Around Earnings Announcements Most recent -0.027-0.013 -0.007 -0.0030.000 0.004 0.007 0.012 0.018 0.035 announcement First announcement after-0.011 -0.004-0.001 0.0000.002 0.003 0.004 0.006 0.009 0.015 portfolio formation Second announcement -0.002 0.000 0.000 0.0010.001 0.0030.003 0.003 0.005 0.008 after portfolio formation Third announcement 0.002 0.001 0.002 0.0010.0020.0010.003 0.003 0.003 0.005 atter porttolio formation Fourth announcement 0.0030.0010.0020.0010.0010.0000.0010.0020.001 0.001 after portfolio formation
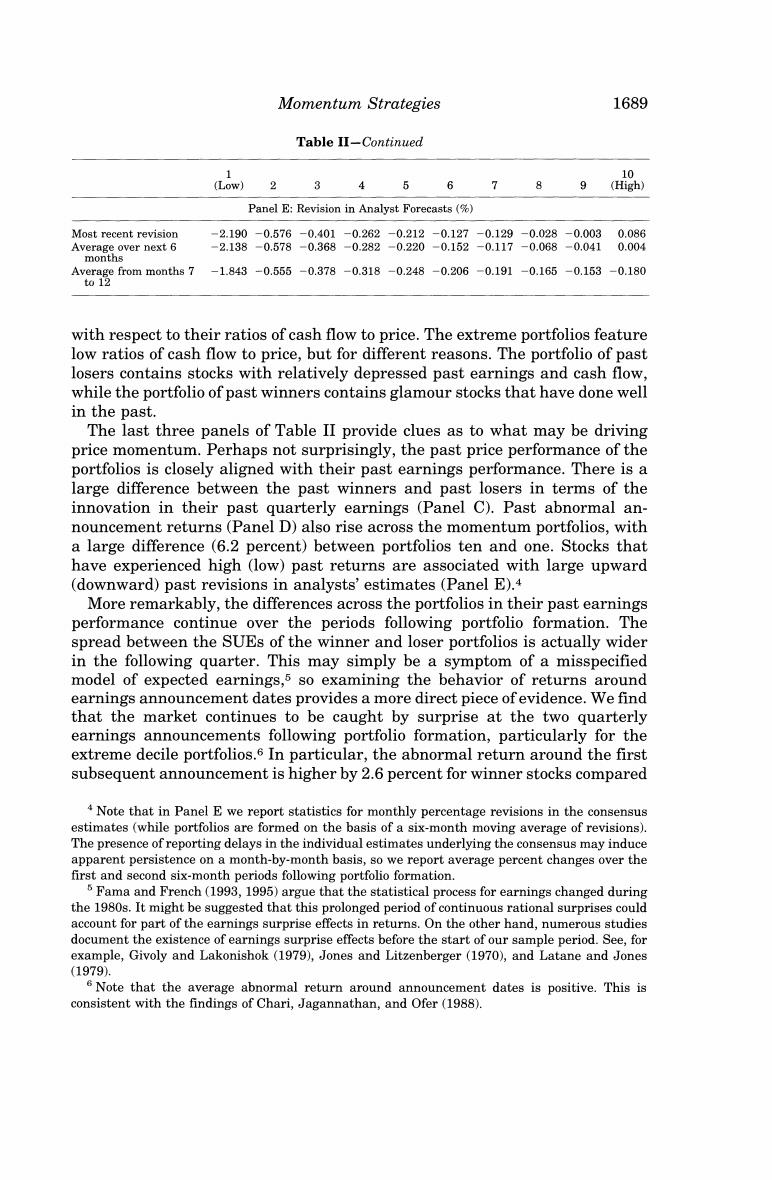
Momentum Strategies 1689 Table II-Continued 10 (Low) 2 3 4 5 6 7 8 9 (High) Panel E:Revision in Analyst Forecasts(%) Most recent revision -2.190-0.576-0.401 -0.262-0.212-0.127-0.129-0.028-0.003 0.086 Average over next 6 -2.138-0.578-0.368-0.282-0.220-0.152-0.117-0.068-0.041 0.004 months Average from months 7 -1.843-0.555-0.378-0.318-0.248-0.206-0.191-0.165-0.153-0.180 t012 with respect to their ratios of cash flow to price.The extreme portfolios feature low ratios of cash flow to price,but for different reasons.The portfolio of past losers contains stocks with relatively depressed past earnings and cash flow, while the portfolio of past winners contains glamour stocks that have done well in the past. The last three panels of Table II provide clues as to what may be driving price momentum.Perhaps not surprisingly,the past price performance of the portfolios is closely aligned with their past earnings performance.There is a large difference between the past winners and past losers in terms of the innovation in their past quarterly earnings (Panel C).Past abnormal an- nouncement returns (Panel D)also rise across the momentum portfolios,with a large difference (6.2 percent)between portfolios ten and one.Stocks that have experienced high (low)past returns are associated with large upward (downward)past revisions in analysts'estimates (Panel E).4 More remarkably,the differences across the portfolios in their past earnings performance continue over the periods following portfolio formation.The spread between the SUEs of the winner and loser portfolios is actually wider in the following quarter.This may simply be a symptom of a misspecified model of expected earnings,5 so examining the behavior of returns around earnings announcement dates provides a more direct piece of evidence.We find that the market continues to be caught by surprise at the two quarterly earnings announcements following portfolio formation,particularly for the extreme decile portfolios.6 In particular,the abnormal return around the first subsequent announcement is higher by 2.6 percent for winner stocks compared 4 Note that in Panel E we report statistics for monthly percentage revisions in the consensus estimates (while portfolios are formed on the basis of a six-month moving average of revisions) The presence of reporting delays in the individual estimates underlying the consensus may induce apparent persistence on a month-by-month basis,so we report average percent changes over the first and second six-month periods following portfolio formation. 5 Fama and French(1993,1995)argue that the statistical process for earnings changed during the 1980s.It might be suggested that this prolonged period of continuous rational surprises could account for part of the earnings surprise effects in returns.On the other hand,numerous studies document the existence of earnings surprise effects before the start of our sample period.See,for example,Givoly and Lakonishok (1979),Jones and Litzenberger (1970),and Latane and Jones (1979). s Note that the average abnormal return around announcement dates is positive.This is consistent with the findings of Chari,Jagannathan,and Ofer(1988)