The Cross-Section of Expected Stock Returns STOR Eugene F.Fama;Kenneth R.French The Journal of Finance,Volume 47,Issue 2 (Jun.,1992),427-465. Stable URL: hutp://links.istor.org/sici?sici=0022-1082%28199206%2947%3A2%3C427%3ATCOESR3E2.0.CO%3B2-N Your use of the JSTOR archive indicates your acceptance of JSTOR's Terms and Conditions of Use,available at http://www.jstor.org/about/terms.html.JSTOR's Terms and Conditions of Use provides,in part,that unless you have obtained prior permission,you may not download an entire issue of a journal or multiple copies of articles,and you may use content in the JSTOR archive only for your personal,non-commercial use. Each copy of any part of a JSTOR transmission must contain the same copyright notice that appears on the screen or printed page of such transmission. The Journal of Finance is published by American Finance Association.Please contact the publisher for further permissions regarding the use of this work.Publisher contact information may be obtained at http://www.jstor.org/journals/afina.html. The Journal of Finance 1992 American Finance Association JSTOR and the JSTOR logo are trademarks of JSTOR,and are Registered in the U.S.Patent and Trademark Office. For more information on JSTOR contact jstor-info@umich.edu. ©2003 JSTOR http://www.jstor.org/ Tue Feb1801:53:102003
THE JOURNAL OF FINANCE.VOL.XLVII,NO.2.JUNE 1992 The Cross-Section of Expected Stock Returns EUGENE F.FAMA and KENNETH R.FRENCH* ABSTRACT Two easily measured variables,size and book-to-market equity,combine to capture the cross-sectional variation in average stock returns associated with market B, size,leverage,book-to-market equity,and earnings-price ratios.Moreover,when the tests allow for variation in B that is unrelated to size,the relation between market 8 and average return is flat,even when 8 is the only explanatory variable. THE ASSET-PRICING MODEL OF Sharpe (1964),Lintner (1965),and Black (1972) has long shaped the way academics and practitioners think about average returns and risk.The central prediction of the model is that the market portfolio of invested wealth is mean-variance efficient in the sense of Markowitz (1959).The efficiency of the market portfolio implies that (a) expected returns on securities are a positive linear function of their market Bs(the slope in the regression of a security's return on the market's return), and (b)market Bs suffice to describe the cross-section of expected returns. There are several empirical contradictions of the Sharpe-Lintner-Black (SLB)model.The most prominent is the size effect of Banz(1981).He finds that market equity,ME (a stock's price times shares outstanding),adds to the explanation of the cross-section of average returns provided by market Bs.Average returns on small (low ME)stocks are too high given their B estimates,and average returns on large stocks are too low. Another contradiction of the SLB model is the positive relation between leverage and average return documented by Bhandari (1988).It is plausible that leverage is associated with risk and expected return,but in the SLB model,leverage risk should be captured by market B.Bhandari finds,how- ever,that leverage helps explain the cross-section of average stock returns in tests that include size(ME)as well as 8. Stattman (1980)and Rosenberg,Reid,and Lanstein (1985)find that aver- age returns on U.S.stocks are positively related to the ratio of a firm's book value of common equity,BE,to its market value,ME.Chan,Hamao,and Lakonishok (1991)find that book-to-market equity,BE/ME,also has a strong role in explaining the cross-section of average returns on Japanese stocks. *Graduate School of Business,University of Chicago,1101 East 58th Street,Chicago,IL 60637.We acknowledge the helpful comments of David Booth,Nai-fu Chen,George Constan. tinides,Wayne Ferson,Edward George,Campbell Harvey,Josef Lakonishok,Rex Sinquefield, Rene Stulz,Mark Zmijeweski,and an anonymous referee.This research is supported by the National Science Foundation(Fama)and the Center for Research in Security Prices (French). 427
428 The Journal of Finance Finally,Basu (1983)shows that earnings-price ratios (E/P)help explain the cross-section of average returns on U.S.stocks in tests that also include size and market B.Ball (1978)argues that E/P is a catch-all proxy for unnamed factors in expected returns;E/P is likely to be higher (prices are lower relative to earnings)for stocks with higher risks and expected returns, whatever the unnamed sources of risk. Ball's proxy argument for E/P might also apply to size (ME),leverage,and book-to-market equity.All these variables can be regarded as different ways to scale stock prices,to extract the information in prices about risk and expected returns (Keim (1988)).Moreover,since E/P,ME,leverage,and BE/ME are all scaled versions of price,it is reasonable to expect that some of them are redundant for describing average returns.Our goal is to evaluate the joint roles of market 8,size,E/P,leverage,and book-to-market equity in the cross-section of average returns on NYSE,AMEX,and NASDAQ stocks Black,Jensen,and Scholes(1972)and Fama and MacBeth (1973)find that, as predicted by the SLB model,there is a positive simple relation between average stock returns and B during the pre-1969 period.Like Reinganum (1981)and Lakonishok and Shapiro(1986),we find that the relation between B and average return disappears during the more recent 1963-1990 period, even when B is used alone to explain average returns.The appendix shows that the simple relation between 8 and average return is also weak in the 50-year 1941-1990 period.In short,our tests do not support the most basic prediction of the SLB model,that average stock returns are positively related to market Bs. Unlike the simple relation between B and average return,the univariate relations between average return and size,leverage,E/P,and book-to-market equity are strong.In multivariate tests,the negative relation between size and average return is robust to the inclusion of other variables.The positive relation between book-to-market equity and average return also persists in competition with other variables.Moreover,although the size effect has attracted more attention,book-to-market equity has a consistently stronger role in average returns.Our bottom-line results are:(a)B does not seem to help explain the cross-section of average stock returns,and (b)the combina- tion of size and book-to-market equity seems to absorb the roles of leverage and E/P in average stock returns,at least during our 1963-1990 sample period. If assets are priced rationally,our results suggest that stock risks are multidimensional.One dimension of risk is proxied by size,ME.Another dimension of risk is proxied by BE/ME,the ratio of the book value of common equity to its market value. It is possible that the risk captured by BE/ME is the relative distress factor of Chan and Chen(1991).They postulate that the earning prospects of firms are associated with a risk factor in returns.Firms that the market judges to have poor prospects,signaled here by low stock prices and high ratios of book-to-market equity,have higher expected stock returns(they are penalized with higher costs of capital)than firms with strong prospects.It is
The Cross-Section of Expected Stock Returns 429 also possible,however,that BE/ME just captures the unraveling (regression toward the mean)of irrational market whims about the prospects of firms. Whatever the underlying economic causes,our main result is straightfor- ward.Two easily measured variables,size (ME)and book-to-market equity (BE/ME),provide a simple and powerful characterization of the cross-section of average stock returns for the 1963-1990 period. In the next section we discuss the data and our approach to estimating B. Section II examines the relations between average return and B and between average return and size.Section III examines the roles of E/P,leverage,and book-to-market equity in average returns.In sections IV and V,we summa- rize,interpret,and discuss applications of the results. I.Preliminaries A.Data We use all nonfinancial firms in the intersection of (a)the NYSE,AMEX, and NASDAQ return files from the Center for Research in Security Prices (CRSP)and (b)the merged COMPUSTAT annual industrial files of income- statement and balance-sheet data,also maintained by CRSP.We exclude financial firms because the high leverage that is normal for these firms probably does not have the same meaning as for nonfinancial firms,where high leverage more likely indicates distress.The CRSP returns cover NYSE and AMEX stocks until 1973 when NASDAQ returns also come on line.The COMPUSTAT data are for 1962-1989.The 1962 start date reflects the fact that book value of common equity(COMPUSTAT item 60),is not generally available prior to 1962.More important,COMPUSTAT data for earlier years have a serious selection bias;the pre-1962 data are tilted toward big histori- cally successful firms. To ensure that the accounting variables are known before the returns they are used to explain,we match the accounting data for all fiscal yearends in calendar year t-1(1962-1989)with the returns for July of year t to June of t+1.The 6-month(minimum)gap between fiscal yearend and the return tests is conservative.Earlier work (e.g.,Basu (1983))often assumes that accounting data are available within three months of fiscal yearends.Firms are indeed required to file their 10-K reports with the SEC within 90 days of their fiscal yearends,but on average 19.8%do not comply.In addition,more than 40%of the December fiscal yearend firms that do comply with the 90-day rule file on March 31,and their reports are not made public until April.(See Alford,Jones,and Zmijewski (1992).) We use a firm's market equity at the end of December of year t-1 to compute its book-to-market,leverage,and earnings-price ratios for t-1,and we use its market equity for June of year t to measure its size.Thus,to be included in the return tests for July of year t,a firm must have a CRSP stock price for December of year t-1 and June of year t.It must also have monthly returns for at least 24 of the 60 months preceding July of year t(for

430 The Journal of Finance "pre-ranking''B estimates,discussed below).And the firm must have COMPUSTAT data on total book assets (A),book equity (BE),and earn- ings (E),for its fiscal year ending in (any month of)calendar year t-1. Our use of December market equity in the E/P,BE/ME,and leverage ratios is objectionable for firms that do not have December fiscal yearends because the accounting variable in the numerator of a ratio is not aligned with the market value in the denominator.Using ME at fiscal yearends is also problematic;then part of the cross-sectional variation of a ratio for a given year is due to market-wide variation in the ratio during the year.For example,if there is a general fall in stock prices during the year,ratios measured early in the year will tend to be lower than ratios measured later. We can report,however,that the use of fiscal-yearend MEs,rather than December MEs,in the accounting ratios has little impact on our return tests. Finally,the tests mix firms with different fiscal yearends.Since we match accounting data for all fiscal yearends in calendar year t-1 with returns for July of t to June of t+1,the gap between the accounting data and the matching returns varies across firms.We have done the tests using the smaller sample of firms with December fiscal yearends with similar results. B.Estimating Market Bs Our asset-pricing tests use the cross-sectional regression approach of Fama and MacBeth (1973).Each month the cross-section of returns on stocks is regressed on variables hypothesized to explain expected returns.The time- series means of the monthly regression slopes then provide standard tests of whether different explanatory variables are on average priced. Since size,E/P,leverage,and BE/ME are measured precisely for individ- ual stocks,there is no reason to smear the information in these variables by using portfolios in the Fama-MacBeth(FM)regressions.Most previous tests use portfolios because estimates of market Bs are more precise for portfolios. Our approach is to estimate Bs for portfolios and then assign a portfolio's B to each stock in the portfolio.This allows us to use individual stocks in the FM asset-pricing tests. B.1.B Estimation:Details In June of each year,all NYSE stocks on CRSP are sorted by size (ME) to determine the NYSE decile breakpoints for ME.NYSE,AMEX,and NASDAQ stocks that have the required CRSP-COMPUSTAT data are then allocated to 10 size portfolios based on the NYSE breakpoints.(If we used stocks from all three exchanges to determine the ME breakpoints,most portfolios would include only small stocks after 1973,when NASDAQ stocks are added to the sample. We form portfolios on size because of the evidence of Chan and Chen (1988) and others that size produces a wide spread of average returns and Bs.Chan and Chen use only size portfolios.The problem this creates is that size and the Bs of size portfolios are highly correlated (-0.988 in their data),so
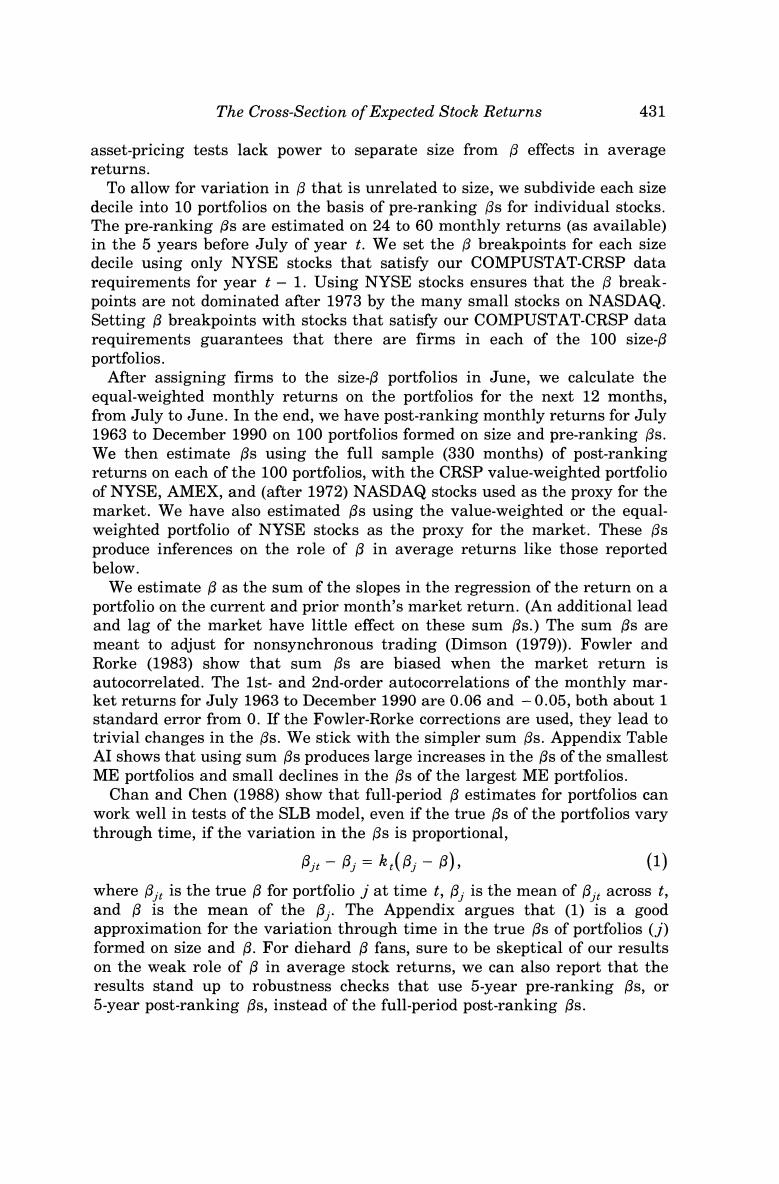
The Cross-Section of Expected Stock Returns 431 asset-pricing tests lack power to separate size from B effects in average returns. To allow for variation in B that is unrelated to size,we subdivide each size decile into 10 portfolios on the basis of pre-ranking Bs for individual stocks. The pre-ranking Bs are estimated on 24 to 60 monthly returns (as available) in the 5 years before July of year t.We set the B breakpoints for each size decile using only NYSE stocks that satisfy our COMPUSTAT-CRSP data requirements for year t-1.Using NYSE stocks ensures that the 8 break- points are not dominated after 1973 by the many small stocks on NASDAQ. Setting B breakpoints with stocks that satisfy our COMPUSTAT-CRSP data requirements guarantees that there are firms in each of the 100 size-B portfolios. After assigning firms to the size-B portfolios in June,we calculate the equal-weighted monthly returns on the portfolios for the next 12 months, from July to June.In the end,we have post-ranking monthly returns for July 1963 to December 1990 on 100 portfolios formed on size and pre-ranking Bs. We then estimate Bs using the full sample (330 months)of post-ranking returns on each of the 100 portfolios,with the CRSP value-weighted portfolio of NYSE,AMEX,and (after 1972)NASDAQ stocks used as the proxy for the market.We have also estimated Bs using the value-weighted or the equal- weighted portfolio of NYSE stocks as the proxy for the market.These Bs produce inferences on the role of B in average returns like those reported below. We estimate B as the sum of the slopes in the regression of the return on a portfolio on the current and prior month's market return.(An additional lead and lag of the market have little effect on these sum Bs.)The sum Bs are meant to adjust for nonsynchronous trading (Dimson (1979)).Fowler and Rorke (1983)show that sum Bs are biased when the market return is autocorrelated.The 1st-and 2nd-order autocorrelations of the monthly mar. ket returns for July 1963 to December 1990 are 0.06 and-0.05,both about 1 standard error from 0.If the Fowler-Rorke corrections are used,they lead to trivial changes in the Bs.We stick with the simpler sum Bs.Appendix Table AI shows that using sum Bs produces large increases in the Bs of the smallest ME portfolios and small declines in the Bs of the largest ME portfolios Chan and Chen (1988)show that full-period B estimates for portfolios can work well in tests of the SLB model,even if the true Bs of the portfolios vary through time,if the variation in the Bs is proportional, Bt-月,=k.(B,-8), (1) where B;is the true B for portfolio j at time t,B;is the mean of Bit across t, and B is the mean of the B,.The Appendix argues that (1)is a good approximation for the variation through time in the true Bs of portfolios (j) formed on size and B.For diehard B fans,sure to be skeptical of our results on the weak role of B in average stock returns,we can also report that the results stand up to robustness checks that use 5-year pre-ranking Bs,or 5-year post-ranking Bs,instead of the full-period post-ranking Bs

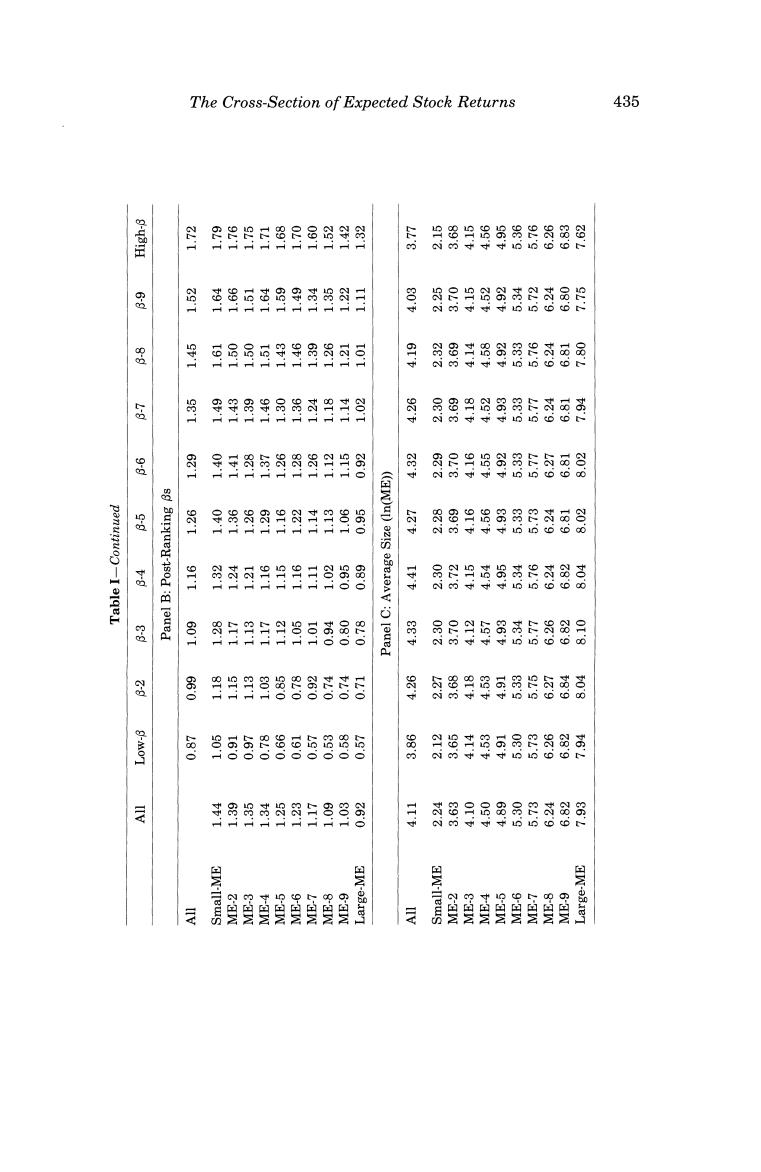
432 The Journal of Finance We allocate the full-period post-ranking 8 of a size-B portfolio to each stock in the portfolio.These are the Bs that will be used in the Fama-MacBeth cross-sectional regressions for individual stocks.We judge that the precision of the full-period post-ranking portfolio Bs,relative to the imprecise 8 esti- mates that would be obtained for individual stocks,more than makes up for the fact that true Bs are not the same for all stocks in a portfolio.And note that assigning full-period portfolio Bs to stocks does not mean that a stock's B is constant.A stock can move across portfolios with year-to-year changes in the stock's size (ME)and in the estimates of its B for the preceding 5 years. B.2.B Estimates Table I shows that forming portfolios on size and pre-ranking Bs,rather than on size alone,magnifies the range of full-period post-ranking Bs.Sorted on size alone,the post-ranking Bs range from 1.44 for the smallest ME portfolio to 0.92 for the largest.This spread of Bs across the 10 size deciles is smaller than the spread of post-ranking Bs produced by the B sort of any size decile.For example,the post-ranking Bs for the 10 portfolios in the smallest size decile range from 1.05 to 1.79.Across all 100 size-B portfolios,the post-ranking Bs range from 0.53 to 1.79,a spread 2.4 times the spread,0.52, obtained with size portfolios alone. Two other facts about the Bs are important.First,in each size decile the post-ranking Bs closely reproduce the ordering of the pre-ranking Bs.We take this to be evidence that the pre-ranking B sort captures the ordering of true post-ranking Bs.(The appendix gives more evidence on this important issue.)Second,the B sort is not a refined size sort.In any size decile,the average values of In(ME)are similar across the B-sorted portfolios.Thus the pre-ranking B sort achieves its goal.It produces strong variation in post- ranking Bs that is unrelated to size.This is important in allowing our tests to distinguish between B and size effects in average returns. II.B and Size The Sharpe-Lintner-Black(SLB)model plays an important role in the way academics and practitioners think about risk and the relation between risk and expected return.We show next that when common stock portfolios are formed on size alone,there seems to be evidence for the model's central prediction:average return is positively related to B.The Bs of size portfolios are,however,almost perfectly correlated with size,so tests on size portfolios are unable to disentangle B and size effects in average returns.Allowing for variation in B that is unrelated to size breaks the logjam,but at the expense of B.Thus,when we subdivide size portfolios on the basis of pre-ranking Bs, we find a strong relation between average return and size,but no relation between average return and B
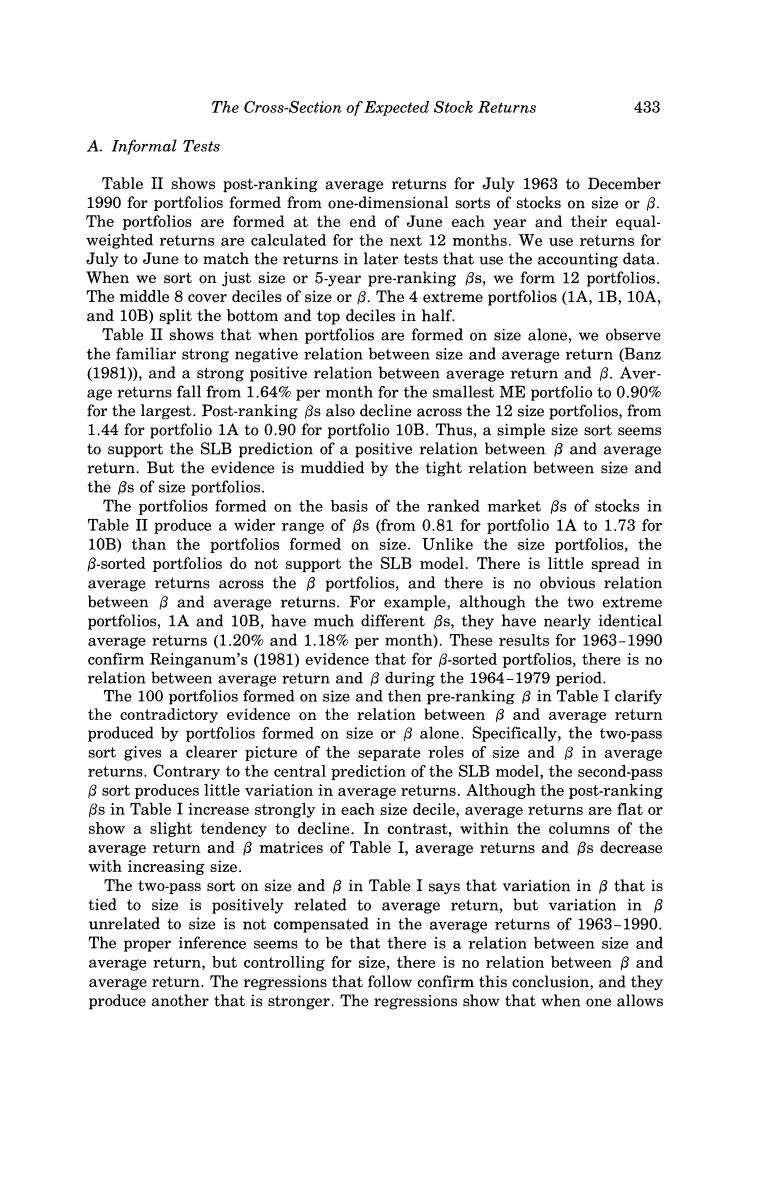
The Cross-Section of Expected Stock Returns 433 A.Informal Tests Table II shows post-ranking average returns for July 1963 to December 1990 for portfolios formed from one-dimensional sorts of stocks on size or B. The portfolios are formed at the end of June each year and their equal- weighted returns are calculated for the next 12 months.We use returns for July to June to match the returns in later tests that use the accounting data. When we sort on just size or 5-year pre-ranking Bs,we form 12 portfolios. The middle 8 cover deciles of size or B.The 4 extreme portfolios(1A,1B,10A, and 10B)split the bottom and top deciles in half. Table II shows that when portfolios are formed on size alone,we observe the familiar strong negative relation between size and average return(Banz (1981)),and a strong positive relation between average return and B.Aver- age returns fall from 1.64%per month for the smallest ME portfolio to 0.90% for the largest.Post-ranking Bs also decline across the 12 size portfolios,from 1.44 for portfolio 1A to 0.90 for portfolio 10B.Thus,a simple size sort seems to support the SLB prediction of a positive relation between B and average return.But the evidence is muddied by the tight relation between size and the Bs of size portfolios. The portfolios formed on the basis of the ranked market Bs of stocks in Table II produce a wider range of Bs (from 0.81 for portfolio 1A to 1.73 for 10B)than the portfolios formed on size.Unlike the size portfolios,the B-sorted portfolios do not support the SLB model.There is little spread in average returns across the 8 portfolios,and there is no obvious relation between B and average returns.For example,although the two extreme portfolios,1A and 10B,have much different Bs,they have nearly identical average returns (1.20%and 1.18%per month).These results for 1963-1990 confirm Reinganum's(1981)evidence that for B-sorted portfolios,there is no relation between average return and 8 during the 1964-1979 period. The 100 portfolios formed on size and then pre-ranking B in Table I clarify the contradictory evidence on the relation between B and average return produced by portfolios formed on size or 8 alone.Specifically,the two-pass sort gives a clearer picture of the separate roles of size and B in average returns.Contrary to the central prediction of the SLB model,the second-pass B sort produces little variation in average returns.Although the post-ranking Bs in Table I increase strongly in each size decile,average returns are flat or show a slight tendency to decline.In contrast,within the columns of the average return and B matrices of Table I,average returns and Bs decrease with increasing size. The two-pass sort on size and B in Table I says that variation in B that is tied to size is positively related to average return,but variation in B unrelated to size is not compensated in the average returns of 1963-1990. The proper inference seems to be that there is a relation between size and average return,but controlling for size,there is no relation between B and average return.The regressions that follow confirm this conclusion,and they produce another that is stronger.The regressions show that when one allows

434 The Finance , 女真1 日 e 多 0 o 器 6.8 921 22.1 芦 员 門 三 尉 8 真0L 85.1 豆 8 2 高 女01 日 品 82.1 应 I alqeL 066I aqwaad01 896I Amp 0y3 1oaw 1ey1 sy0s OVaSVN pue 'XaNV 'SAN lIV 'dSHO uo syoos SAN IIe Suisn (0661-896I =1)1 BoK Jo aunp Aly uow jo seak g o1 Z yM payeunsa'syoons IenpLarpur jo sg SuryueI-aad Sursn sorronod g OI our paptarpqns sr amoap eep LVISndWOO'dSHo 9y 1aaw qe1 syoons SAN A[uo asn aM '1 eoK jo aunf ur Bu!pua (alqelleAe se)sumngax uayi are so!ojod 00I 3urmnsal ay3 uo suingaI Alyquou pany3ram-Tenba auL'squrodyeaq g ayl ys!lqease o squawalbai auL 'o!opod yoea iog suangaI Burxuet-asod Jo aldues (066T aqwaoa(I o 896I Amnp)IInj ay3 asn sg Surxue-sod auL 足 25.1 02.1 员 高 5.1 I9'I 8 照 89.1 8 'I eax jo aunp on 1 eaf Jo Amnp oJ panemno[eo 'sIellop Jo suorllu u!payeurwouap HI yIM Ieaf 8 厨8 pue II uaamiaq st salroap azts L 1saBaeI ay g-MOI 女2.1 8 6 8 0 专 201 8 的图 爱 L-aW 8aW 6
The Cross-Section of Expected Stock Returns 435 思9日8e 品的斜 9器9治品贵思贵贸 6时防寸 to t 爱 落回 9 品的 罩 389 料贰品 oic时中iun606 照 451 器闲时 101 斜8寸品的积青西品 11 0 O 胡 9 员号 801 出 62.1 于的品 图格斜 群 周 ci co 得好每贸后包石器 盟 品 P01 9 罩 尊 8 y 导 的朗 2高司 器 爱 手 品 0n0⊙ 60.1 859片 号 8 820 解 品8 6的房长88 oi co 的0o0 o 66.0 99的8 器 9 路分的9黄 0 0 s 苦 1.0 od 8-MOI 马 阳 三 250 月棉中超耳 云 的贵盼 三 贰超马 用品 尉8 員星 6-HW 3W-08e1 灵 W &W 6I W-a8eI