Bond and Stock Market Response to Unexpected Earnings Announcements Sudip Datta;Upinder S.Dhillon The Journal of Financial and Quantitative Analysis,Volume 28,Issue 4 (Dec.,1993), 565-577. Stable URL: hutp://links.jstor.org/sici?sici=0022-1090%28199312%2928%3A4%3C565%3ABASMRT3E2.0.CO%3B2-D Your use of the JSTOR archive indicates your acceptance of JSTOR's Terms and Conditions of Use,available at http://www.jstor.org/about/terms.html.JSTOR's Terms and Conditions of Use provides,in part,that unless you have obtained prior permission,you may not download an entire issue of a journal or multiple copies of articles,and you may use content in the JSTOR archive only for your personal,non-commercial use. Each copy of any part of a JSTOR transmission must contain the same copyright notice that appears on the screen or printed page of such transmission. The Journal of Financial and Quantitative Analysis is published by University of Washington School of Business Administration.Please contact the publisher for further permissions regarding the use of this work.Publisher contact information may be obtained at http://www.jstor.org/journals/uwash.html. The Journal of Financial and Quantitative Analysis 1993 University of Washington School of Business Administration JSTOR and the JSTOR logo are trademarks of JSTOR,and are Registered in the U.S.Patent and Trademark Office. For more information on JSTOR contact jstor-info@umich.edu. ©2003 JSTOR http://www.jstor.org/ Mon Feb1717:31:132003
JOURNAL OF FINANCIAL AND QUANTITATIVE ANALYSIS VOL 28,NO 4,DECEMBER 1993 Bond and Stock Market Response to Unexpected Earnings Announcements Sudip Datta and Upinder S.Dhillon* Abstract This study examines whether earnings changes convey information in bond markets and finds a significant positive (negative)reaction to unexpected earnings increases (decreases). The results are consistent whether earnings announcements precede or follow dividend announcements.Thus,earnings surprises convey information to bond markets and changes in firm value are split among bondholders and stockholders.This is in contrast to evidence from studies examining unexpected dividend announcements where bond price reaction is asymmetric.Cross-sectional analysis reveals that bond excess returns are positively related to earnings surprises. I.Introduction Stock market reaction to earnings announcements has received significant attention in the finance and accounting literature.Ball and Brown(1968),Brown (1978),Watts(1978),Aharony and Swary (1980),and Fried and Givoly (1982)are some of the studies that observe a revision of stock prices associated with the release of earnings information.Lev (1989)provides a survey of research in this area.The explanation for the above empirical findings is that unexpected earnings provide new information about future cash flows.Furthermore,the classical discounted cash flow model predicts a revision in firm value that is the present value ofexpected future cash flows.Whether this increased firm value accrues to stockholders and bondholders is an empirical issue.Past research on the information content of earnings has focused solely on stock price behavior and finds at least part of the benefits accrue to stockholders. In this study,we examine the bond market reaction to unexpected quarterly earnings announcements.The study is unique for several reasons.First,dividends, repurchases,and earnings are considered primary mechanisms used by manage- ment to convey information about future cash flows to securityholders.Recent *Bentley College,Department of Finance,Waltham,MA 02254,and SUNY-Binghamton.School of Management,Binghamton,NY 13902-6000,respectively.The authors thank Doug Emery,John Gardner,Bert Horwitz,Herb Johnson,Mai Iskandar,Dennis Lasser,Indu Ravi,and Sara Reiter for their helpful comments.They are especially indebted to an anonymous JFQA referee who provided many suggestions that substantially improved the paper.The authors are also grateful to I/B/E/S Inc. for providing the analyst forecast data.The first author gratefully acknowledges a summer research grant from Bentley College. 565
566 Journal of Financial and Quantitative Analysis studies by Handjinicolaou and Kalay (1984)and Jayaraman and Shastri (1988) examine bond market response to quarterly and special dividends changes,and Vermaelen(1981)and Bartov (1991)document bond price reaction to stock repur- chases.Bond price response to earnings announcements has not been documented thus far.Second,if earnings changes convey new information about expected cash flows then bond markets should respond to these changes since the information is relevant for all participants in capital markets.If the mean of future cash flows changes,stock and bond values change in the same direction.However,if the variance of expected cash flows changes in the option pricing framework,stock and bond returns are expected to adjust in opposite directions.The measure of unexpected earnings used in this study accounts for changes in both mean and variance of earnings expectations. Furthermore,Handjinicolaou and Kalay(1984)find an asymmetric bond price response to dividend changes.They document that bond price reaction to dividend increases is not significant while the reaction to dividend decreases is negative and significant.One possible explanation for these asymmetric results is the presence of dividend restricting covenants in bond indentures that may protect the bond- holders from potential wealth expropriation in the event of unexpected dividend increases.A potential problem with examining bond price reaction to dividend increases (decreases)is the possibility of confounding results,where the positive (negative)impact of dividend signalling may be offset by the negative(positive) effect of wealth transfer from(to)bondholders to (from)stockholders.This study circumvents these problems by examining bond price reaction to quarterly earnings surprises. Third,we isolate the expected and the unexpected or"surprise"components of the earnings announcement,since only the unexpected component has information content.Typically,studies examining the effect of dividend announcements use naive models to identify the unexpected component of the announcement based on the difference between past and current dividends.We use the mean analysts' forecast as a proxy for the market expectation.Thus,the unexpected component of the announcement is the difference between the actual earnings announced and the analysts'mean expectations at that time. Finally,we differentiate between earnings announcements that precede div- idends from those that are made following dividend announcements.Kane,Lee, and Marcus(1984)suggest the existence of a corroborative relationship between dividend and earnings announcements.They conclude that "investors give more credence to unanticipated dividend increases and decreases when earnings are also above or below expectations,and vice versa."Thus,the sequence/timing of earnings and dividend announcements per se may provide additional information. This study documents a significant positive reaction in bond markets to pos- itive earnings surprises and significant negative reaction to unexpected earnings decreases.Furthermore,these results are consistent for earnings announcements both preceding and following dividend announcements.We find a symmetric bond and stock price response to unexpected earnings changes.These results suggest that earnings announcements have information content for both stock and bond markets.Moreover,changes in firm value are split among bondholders and stock- holders.Previous studies examining the effect of dividend announcements on
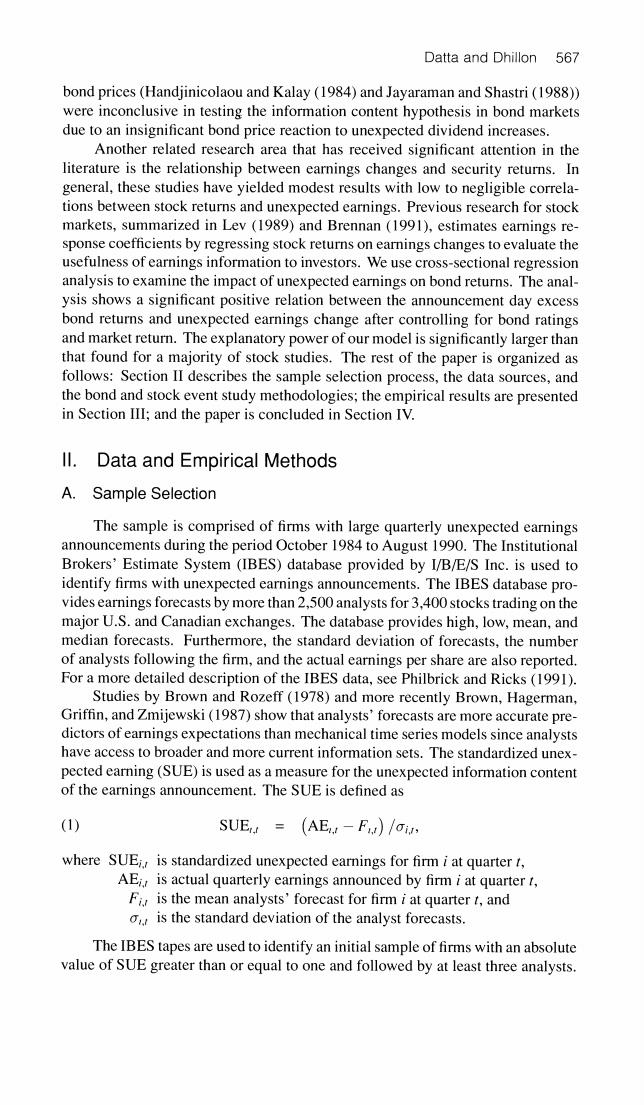
Datta and Dhillon 567 bond prices (Handjinicolaou and Kalay (1984)and Jayaraman and Shastri(1988)) were inconclusive in testing the information content hypothesis in bond markets due to an insignificant bond price reaction to unexpected dividend increases. Another related research area that has received significant attention in the literature is the relationship between earnings changes and security returns.In general,these studies have yielded modest results with low to negligible correla- tions between stock returns and unexpected earnings.Previous research for stock markets,summarized in Lev (1989)and Brennan (1991),estimates earnings re- sponse coefficients by regressing stock returns on earnings changes to evaluate the usefulness of earnings information to investors.We use cross-sectional regression analysis to examine the impact of unexpected earnings on bond returns.The anal- ysis shows a significant positive relation between the announcement day excess bond returns and unexpected earnings change after controlling for bond ratings and market return.The explanatory power of our model is significantly larger than that found for a majority of stock studies.The rest of the paper is organized as follows:Section II describes the sample selection process,the data sources,and the bond and stock event study methodologies;the empirical results are presented in Section III;and the paper is concluded in Section IV. l. Data and Empirical Methods A.Sample Selection The sample is comprised of firms with large quarterly unexpected earnings announcements during the period October 1984 to August 1990.The Institutional Brokers'Estimate System (IBES)database provided by I/B/E/S Inc.is used to identify firms with unexpected earnings announcements.The IBES database pro- vides earnings forecasts by more than 2,500 analysts for 3,400 stocks trading on the major U.S.and Canadian exchanges.The database provides high,low,mean,and median forecasts.Furthermore,the standard deviation of forecasts,the number of analysts following the firm,and the actual earnings per share are also reported. For a more detailed description of the IBES data,see Philbrick and Ricks (1991). Studies by Brown and Rozeff(1978)and more recently Brown,Hagerman, Griffin,and Zmijewski(1987)show that analysts'forecasts are more accurate pre- dictors of earnings expectations than mechanical time series models since analysts have access to broader and more current information sets.The standardized unex- pected earning(SUE)is used as a measure for the unexpected information content of the earnings announcement.The SUE is defined as (1) SUE (AE!-F)/in, where SUEi,is standardized unexpected earnings for firm i at quarter t, AEi,is actual quarterly earnings announced by firm i at quarter t, Fi is the mean analysts'forecast for firm i at quarter t,and o,.is the standard deviation of the analyst forecasts. The IBES tapes are used to identify an initial sample of firms with an absolute value of SUE greater than or equal to one and followed by at least three analysts
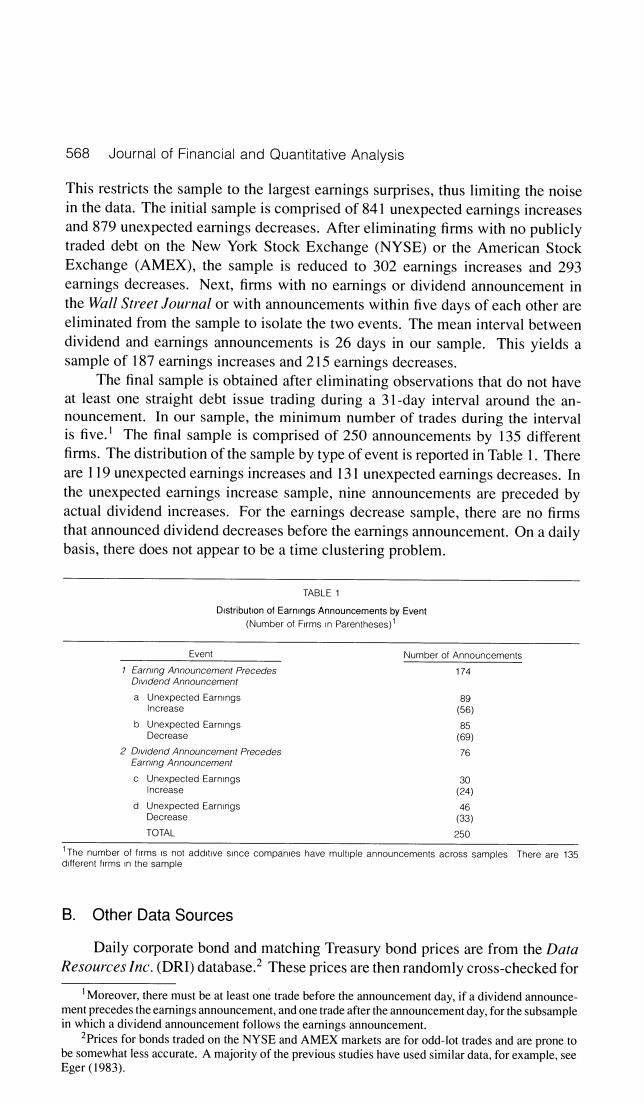
568 Journal of Financial and Quantitative Analysis This restricts the sample to the largest earnings surprises,thus limiting the noise in the data.The initial sample is comprised of 841 unexpected earnings increases and 879 unexpected earnings decreases.After eliminating firms with no publicly traded debt on the New York Stock Exchange (NYSE)or the American Stock Exchange (AMEX),the sample is reduced to 302 earnings increases and 293 earnings decreases.Next,firms with no earnings or dividend announcement in the Wall Street Journal or with announcements within five days of each other are eliminated from the sample to isolate the two events.The mean interval between dividend and earnings announcements is 26 days in our sample.This yields a sample of 187 earnings increases and 215 earnings decreases. The final sample is obtained after eliminating observations that do not have at least one straight debt issue trading during a 31-day interval around the an- nouncement.In our sample,the minimum number of trades during the interval is five.!The final sample is comprised of 250 announcements by 135 different firms.The distribution of the sample by type of event is reported in Table 1.There are 119 unexpected earnings increases and 13I unexpected earnings decreases.In the unexpected earnings increase sample,nine announcements are preceded by actual dividend increases.For the earnings decrease sample,there are no firms that announced dividend decreases before the earnings announcement.On a daily basis,there does not appear to be a time clustering problem. TABLE 1 Distribution of Earnings Announcements by Event (Number of Firms in Parentheses) Event Number of Anncuncements 1 Earning Announcement Precedes 174 Dividend Announcerent a Unexpected Earnings 89 Increase (56) b Unexpected Earnings 85 Decrease (69) 2 Dividend Announcement Precedes 76 Earrng Announcement c Unexpected Earnings 30 (241 d Unexpected Earnings Decrease TOTAL 250 1The number of firms is not additive since companies have multiple announcements across samples There are 135 ditferent firms in the sample B. Other Data Sources Daily corporate bond and matching Treasury bond prices are from the Data Resources Inc.(DRI)database.2 These prices are then randomly cross-checked for Moreover,there must be at least one trade before the announcement day,if a dividend announce- ment precedes the earnings announcement,and one trade after the announcement day,for the subsample in which a dividend announcement follows the earnings announcement. 2Prices for bonds traded on the NYSE and AMEX markets are for odd-lot trades and are prone to be somewhat less accurate.A majority of the previous studies have used similar data,for example,see Eger(1983)

Datta and Dhillon 569 accuracy with prices quoted in the Wall Street Journal (WSJ).In order to compute daily returns from bond prices,with accumulated daily coupon interest,Moody's Bond Record is used to identify the interest payment dates,coupon rates,and maturity dates for the sample of bonds.The stock and market returns are from the University of Chicago's Center for Research in Security Prices(CRSP)daily returns tape. C.Methodology 1.Bond Methodology The mean adjusted returns methodology developed in Masulis(1980)and adapted for bonds in Handjinicolaou and Kalay (1984)is used to estimate excess returns.In order to adjust for changes in term structure of interest rates,adjusted bond return (ABRn)is calculated as follows, (2) ABRin BR -TBRin, where BRi is the bond return for firm i over n days and TBRim is the return over the same period for a matching Treasury bond.3 A 31-day interval around the event is used to estimate the comparison and announcement period returns.When earnings precede dividends,the comparison period is day-29 to day-1.The comparison period is day +2 to day +30 when dividends precede earnings.This method eliminates the problem of contamination of the comparison period by the dividend announcement.The comparison period average daily return(Ricp)for firm i is then (3) Rp=[Dn(1+ABRn)】'/-1, where k is the number of returns in the comparison period.Since bond returns are a series of single and multiple day returns,they are adjusted to yield equivalent single day returns and standardized.Thus, (4) SERis (ABRin -n.Ricp)/SiVn, where SERi,is the daily standardized excess return for firm i and S;is the estimated standard deviation of the comparison period returns for firm i.4 The standardized mean excess return(SMER,)for the portfolio of bonds is then estimated over the entire 31-day period and is given by (5) SMER=∑SER/N 3Treasury bonds with the closest maturity and coupon combination are used in the analysis.First, the set of Treasury issues with the closest maturity is identified,and then the bond with the closest coupon is used for the adjustment. 4There is a potential problem of estimating the standard deviation of the comparison period return from four or five returns.However,in our sample,there are only I I such bonds

570 Journal of Financial and Quantitative Analysis where N is the number of bonds trading on day t.Assuming that the individual stan- dardized excess bond returns are cross-sectionally independent,the appropriate test statistic is (6) Z,=VN(SMER,). If a bond does not trade on the announcement day or day +1,the next trading day is assumed to be the announcement day.This correction is necessary since bonds may not trade daily and information may be incorporated in security returns on the announcement day or the following trading day. 2.Stock Methodology Standard event study methodology is used to determine market-adjusted ex- cess returns for the sample.The market model parameters are estimated on daily returns from 250 to 121 days preceding the event day.The daily excess return for firm j on day t is defined as (7) ERn=Rn-(a+月,Rm) where Ri is the return for security jfor day t,Rmr is the return on the equal-weighted market index,andand are the ordinary least squares estimates of firm j. The average excess returns over all firms in the sample are computed as follows, N (8) AER, ERit/N, where N is the number of firms in the sample. Tests of statistical significance of the excess returns are based on daily stan- dardized excess returns,which are defined as (9) SERi=ERjit/Sit where T 1/2 (10) Si Si 1+1/T+(Rm-Rm)/>(Rm-Rm)2 iel S?is the residual variance of the market model for firm j.T is the number of days in the estimation period (120 to 61 days preceding the event date),and R is the mean market return over the estimation period. The mean standardized excess return is N (11) SMER,= SERit/N. 5In four cases,there are three announcements on the same day and in 31 cases.there are two announcements on the same day.All other announcements are on different calendar days
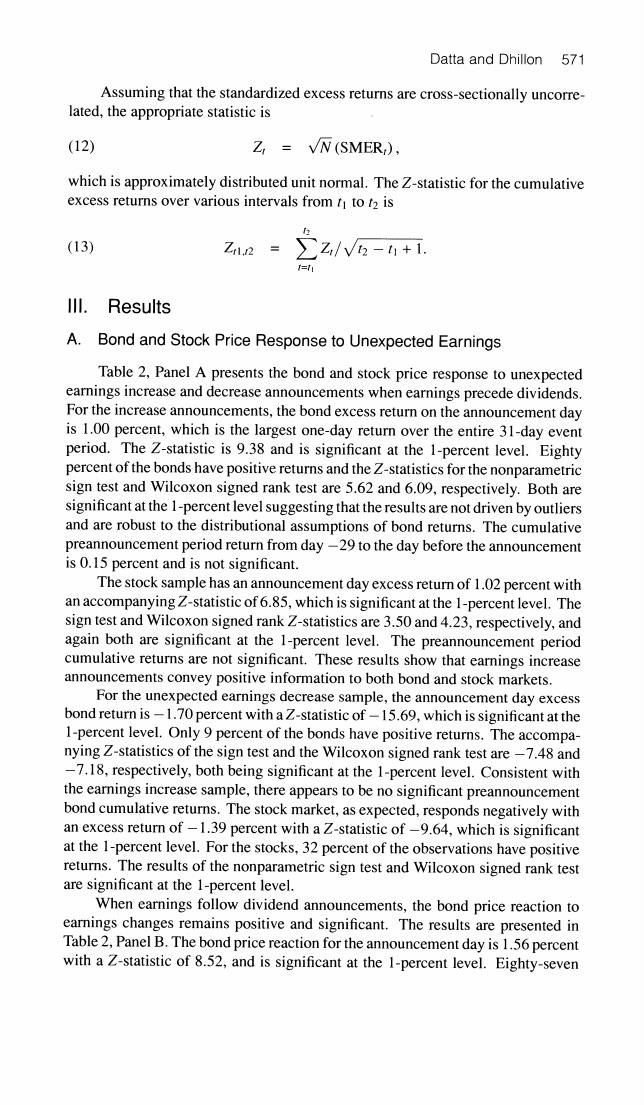
Datta and Dhillon 571 Assuming that the standardized excess returns are cross-sectionally uncorre- lated,the appropriate statistic is (12) Z=VN(SMER,), which is approximately distributed unit normal.The Z-statistic for the cumulative excess returns over various intervals from t to t2 is (13) Z1.2 Z/V2-1+1 = IL. Results A.Bond and Stock Price Response to Unexpected Earnings Table 2,Panel A presents the bond and stock price response to unexpected earnings increase and decrease announcements when earnings precede dividends. For the increase announcements,the bond excess return on the announcement day is 1.00 percent,which is the largest one-day return over the entire 31-day event period.The Z-statistic is 9.38 and is significant at the 1-percent level.Eighty percent of the bonds have positive returns and the Z-statistics for the nonparametric sign test and Wilcoxon signed rank test are 5.62 and 6.09,respectively.Both are significant at the 1-percent level suggesting that the results are not driven by outliers and are robust to the distributional assumptions of bond returns.The cumulative preannouncement period return from day-29 to the day before the announcement is 0.15 percent and is not significant. The stock sample has an announcement day excess return of 1.02 percent with an accompanying Z-statistic of 6.85,which is significant at the 1-percent level.The sign test and Wilcoxon signed rank Z-statistics are 3.50 and 4.23,respectively,and again both are significant at the 1-percent level.The preannouncement period cumulative returns are not significant.These results show that earnings increase announcements convey positive information to both bond and stock markets. For the unexpected earnings decrease sample,the announcement day excess bond return is-1.70 percent with a Z-statistic of-15.69,which is significant at the 1-percent level.Only 9 percent of the bonds have positive returns.The accompa- nying Z-statistics of the sign test and the Wilcoxon signed rank test are-7.48 and -7.18,respectively,both being significant at the 1-percent level.Consistent with the earnings increase sample,there appears to be no significant preannouncement bond cumulative returns.The stock market,as expected,responds negatively with an excess return of-1.39 percent with a Z-statistic of-9.64,which is significant at the 1-percent level.For the stocks,32 percent of the observations have positive returns.The results of the nonparametric sign test and Wilcoxon signed rank test are significant at the 1-percent level. When earnings follow dividend announcements,the bond price reaction to earnings changes remains positive and significant.The results are presented in Table 2,Panel B.The bond price reaction for the announcement day is 1.56 percent with a Z-statistic of 8.52,and is significant at the 1-percent level.Eighty-seven
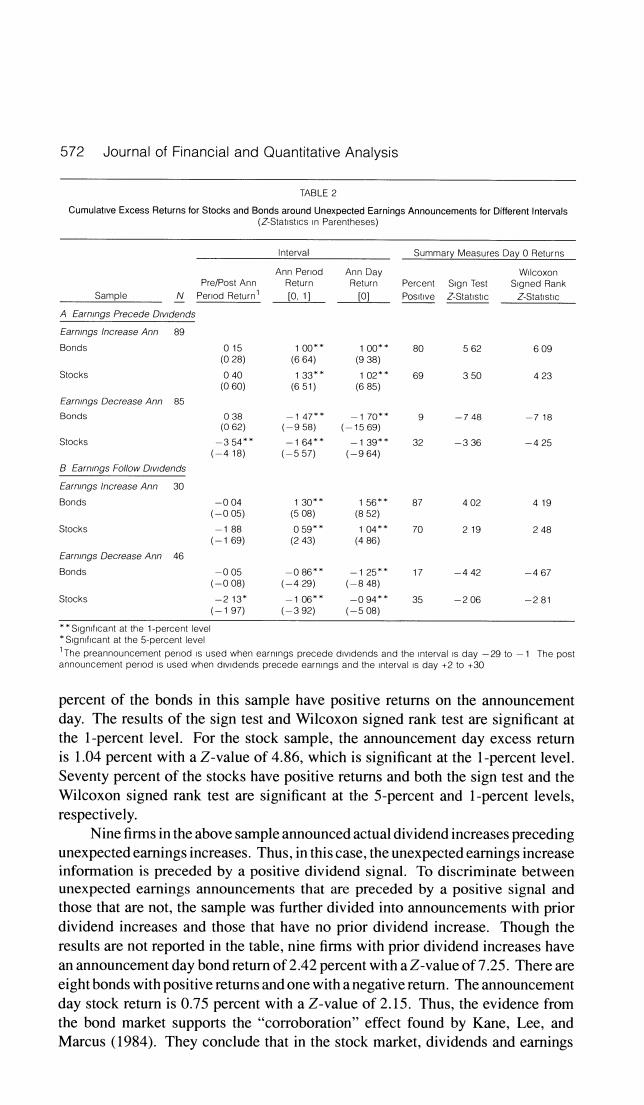
572 Journal of Financial and Quantitative Analysis TABLE 2 Cumulative Excess Returns for Stocks and Bonds around Unexpected Earnings Announcements for Different Intervals (Z-Statistics in Parentheses) Interval Summary Measures Day 0 Returns Ann Penod Ann Day Wilcoxon Pre/Post Ann Return Return Percent Sign Test Signed Rank Sample N Period Return 0.1] o] Positive 2-Statistic Z-Statistic A Earnings Precede Drvidends Earnings Increase Ann 89 Bonds 015 100*· 100*+ 80 562 609 (028) (664) (938) Stocks 040 133** 102*+ 69 350 423 (060) 651) (685) Earnings Decrease Ann 85 Bonds 029 -147年 -170*中 9 -748 -718 (062) (-958) (-1569) Stocks -354* -164*4 -139** 32 -336 -425 (-418) (-557) (-964) B Earnings Follow Drvidends Earnings increase Ann 30 Bonds -004 130* 156** 402 419 (-005) (508) (852) Stocks -188 059✉ 104*· 70 219 248 (-169) (243) {486) Earnings Decrease Ann 46 Bonds -005 -086*- -125* 17 -442 -467 (-008) (-429) (-848) Stocks -213 -106" -094*4 的 -206 -281 (-197 (-392) (-508) Signcant at the 1-percent level Significant at the 5-percent level 1The preannouncement penod is used when earnings precede divdends and the interval is day-29 to-1 The post announcement perod is used when divdends precede earnings and the interval is day +2 to +30 percent of the bonds in this sample have positive returns on the announcement day.The results of the sign test and Wilcoxon signed rank test are significant at the 1-percent level.For the stock sample,the announcement day excess return is 1.04 percent with a Z-value of 4.86,which is significant at the 1-percent level. Seventy percent of the stocks have positive returns and both the sign test and the Wilcoxon signed rank test are significant at the 5-percent and 1-percent levels, respectively. Nine firms in the above sample announced actual dividend increases preceding unexpected earnings increases.Thus,in this case,the unexpected earnings increase information is preceded by a positive dividend signal.To discriminate between unexpected earnings announcements that are preceded by a positive signal and those that are not,the sample was further divided into announcements with prior dividend increases and those that have no prior dividend increase.Though the results are not reported in the table,nine firms with prior dividend increases have an announcement day bond return of 2.42 percent with a Z-value of 7.25.There are eight bonds with positive returns and one with a negative return.The announcement day stock return is 0.75 percent with a Z-value of 2.15.Thus,the evidence from the bond market supports the "corroboration"effect found by Kane,Lee,and Marcus(1984).They conclude that in the stock market,dividends and earnings
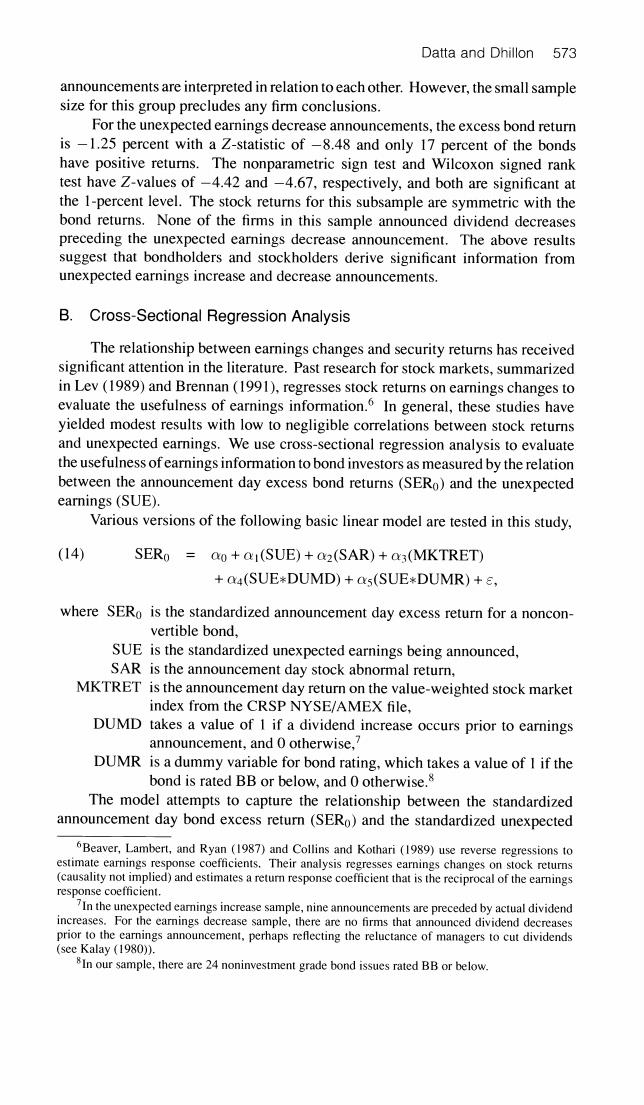
Datta and Dhillon 573 announcements are interpreted in relation to each other.However,the small sample size for this group precludes any firm conclusions. For the unexpected earnings decrease announcements,the excess bond return is -1.25 percent with a Z-statistic of-8.48 and only 17 percent of the bonds have positive returns.The nonparametric sign test and Wilcoxon signed rank test have Z-values of-4.42 and-4.67,respectively,and both are significant at the 1-percent level.The stock returns for this subsample are symmetric with the bond returns.None of the firms in this sample announced dividend decreases preceding the unexpected earnings decrease announcement.The above results suggest that bondholders and stockholders derive significant information from unexpected earnings increase and decrease announcements. B.Cross-Sectional Regression Analysis The relationship between earnings changes and security returns has received significant attention in the literature.Past research for stock markets,summarized in Lev(1989)and Brennan (1991),regresses stock returns on earnings changes to evaluate the usefulness of earnings information.In general,these studies have yielded modest results with low to negligible correlations between stock returns and unexpected earnings.We use cross-sectional regression analysis to evaluate the usefulness of earnings information to bond investors as measured by the relation between the announcement day excess bond returns (SERo)and the unexpected earnings(SUE). Various versions of the following basic linear model are tested in this study, (14) SERo ao+(SUE)+02(SAR)+03(MKTRET) +a4(SUE*DUMD)+as(SUE*DUMR)+s, where SERo is the standardized announcement day excess return for a noncon- vertible bond, SUE is the standardized unexpected earnings being announced, SAR is the announcement day stock abnormal return, MKTRET is the announcement day return on the value-weighted stock market index from the CRSP NYSE/AMEX file, DUMD takes a value of 1 if a dividend increase occurs prior to earnings announcement,and 0 otherwise,? DUMR is a dummy variable for bond rating,which takes a value of I if the bond is rated BB or below,and 0 otherwise.8 The model attempts to capture the relationship between the standardized announcement day bond excess return (SERo)and the standardized unexpected 6Beaver,Lambert,and Ryan (1987)and Collins and Kothari(1989)use reverse regressions to estimate earnings response coefficients.Their analysis regresses earnings changes on stock returns (causality not implied)and estimates a retur response coefficient that is the reciprocal of the earnings response coefficient. 7In the unexpected earnings increase sample,nine announcements are preceded by actual dividend increases.For the earnings decrease sample,there are no firms that announced dividend decreases prior to the earnings announcement,perhaps reflecting the reluctance of managers to cut dividends (see Kalay (1980)). 8In our sample,there are 24 noninvestment grade bond issues rated BB or below