正在加载图片...
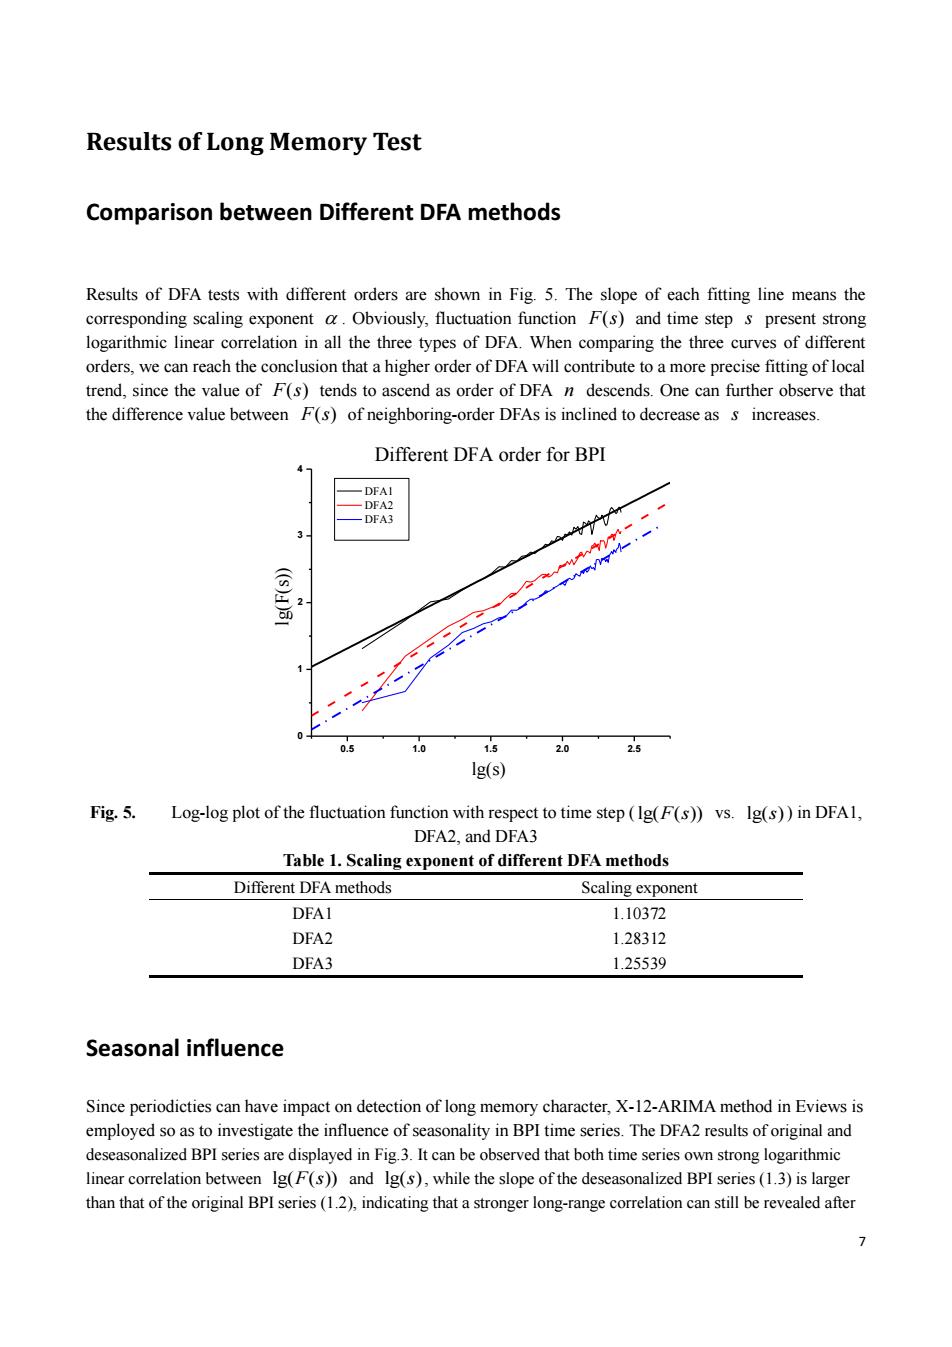
Results of Long Memory Test Comparison between Different DFA methods Results of DFA tests with different orders are shown in Fig.5.The slope of each fitting line means the corresponding scaling exponent a.Obviously,fluctuation function F(s)and time step s present strong logarithmic linear correlation in all the three types of DFA.When comparing the three curves of different orders,we can reach the conclusion that a higher order of DFA will contribute to a more precise fitting of local trend,since the value of F(s)tends to ascend as order of DFA n descends.One can further observe that the difference value between F(s)of neighboring-order DFAs is inclined to decrease as s increases. Different DFA order for BPI DFAI -DEAZ DFA3 3 2 1.0 1.5 20 25 Ig(s) Fig.5. Log-log plot of the fluctuation function with respect to time step(Ig(F(s))vs.Ig(s))in DFAl, DFA2,and DFA3 Table 1.Scaling exponent of different DFA methods Different DFA methods Scaling exponent DFAI 1.10372 DFA2 1.28312 DFA3 1.25539 Seasonal influence Since periodicties can have impact on detection of long memory character,X-12-ARIMA method in Eviews is employed so as to investigate the influence of seasonality in BPI time series.The DFA2 results of original and deseasonalized BPI series are displayed in Fig.3.It can be observed that both time series own strong logarithmic linear correlation between Ig(F(s))and Ig(s),while the slope of the deseasonalized BPI series(1.3)is larger than that of the original BPI series(1.2),indicating that a stronger long-range correlation can still be revealed after7 Results of Long Memory Test Comparison between Different DFA methods Results of DFA tests with different orders are shown in Fig. 5. The slope of each fitting line means the corresponding scaling exponent . Obviously, fluctuation function F s( ) and time step s present strong logarithmic linear correlation in all the three types of DFA. When comparing the three curves of different orders, we can reach the conclusion that a higher order of DFA will contribute to a more precise fitting of local trend, since the value of F s( ) tends to ascend as order of DFA n descends. One can further observe that the difference value between F s( ) of neighboring-order DFAs is inclined to decrease as s increases. 0.5 1.0 1.5 2.0 2.5 0 1 2 3 4 lg(s) Different DFA order for BPI DFA1 DFA2 DFA3 lg(F(s)) Fig. 5. Log-log plot of the fluctuation function with respect to time step ( lg( ( )) F s vs. lg( )s ) in DFA1, DFA2, and DFA3 Table 1. Scaling exponent of different DFA methods Different DFA methods Scaling exponent DFA1 1.10372 DFA2 1.28312 DFA3 1.25539 Seasonal influence Since periodicties can have impact on detection of long memory character, X-12-ARIMA method in Eviews is employed so as to investigate the influence of seasonality in BPI time series. The DFA2 results of original and deseasonalized BPI series are displayed in Fig.3. It can be observed that both time series own strong logarithmic linear correlation between lg( ( )) F s and lg( )s , while the slope of the deseasonalized BPI series (1.3) is larger than that of the original BPI series (1.2), indicating that a stronger long-range correlation can still be revealed after