正在加载图片...
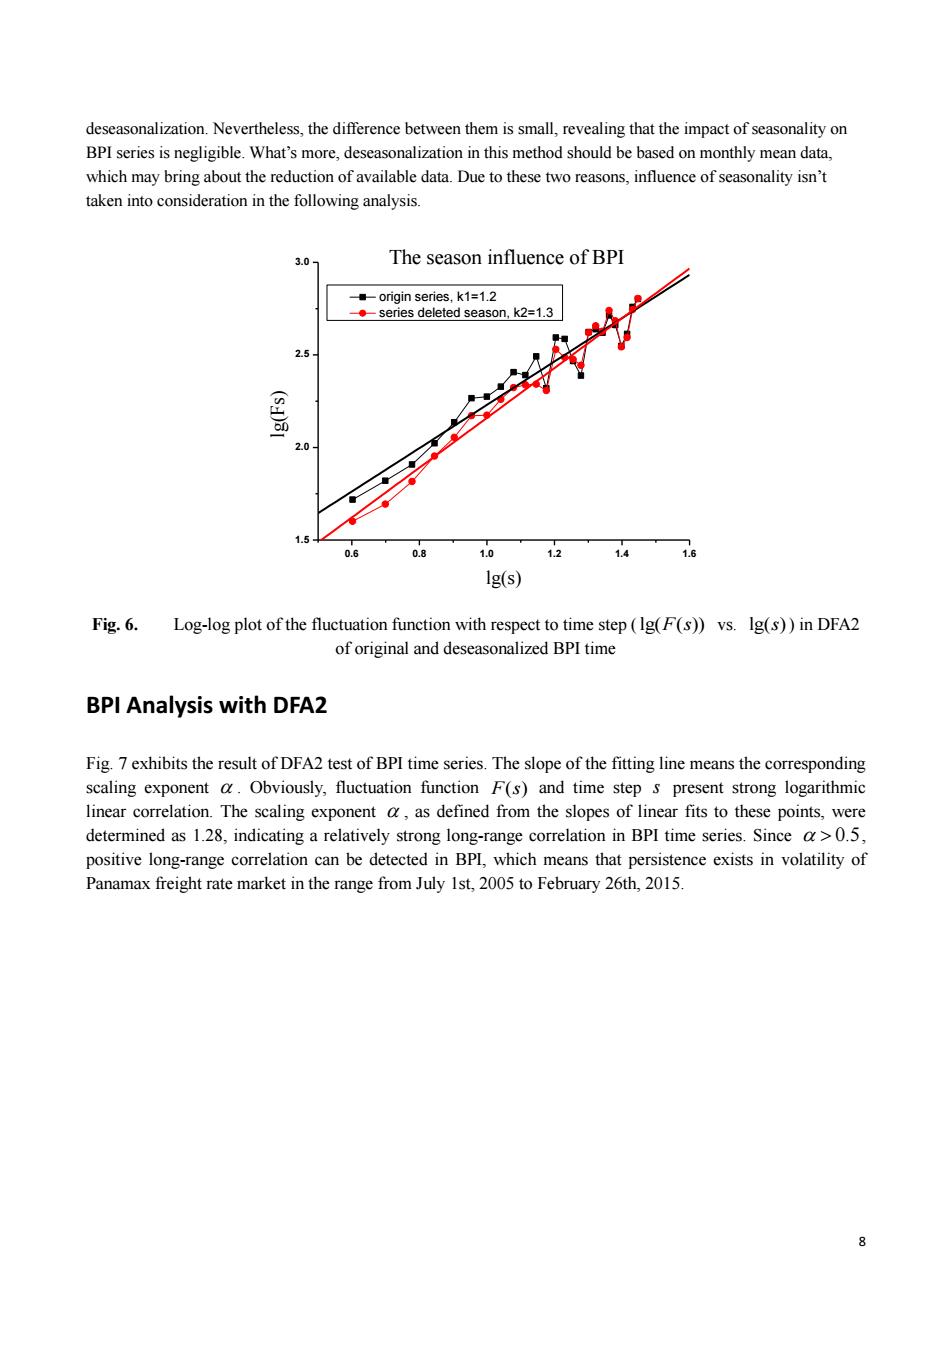
deseasonalization.Nevertheless,the difference between them is small,revealing that the impact of seasonality on BPI series is negligible.What's more,deseasonalization in this method should be based on monthly mean data, which may bring about the reduction of available data.Due to these two reasons,influence of seasonality isn't taken into consideration in the following analysis. 3.0 The season influence of BPI --origin series,k1=1.2 --series deleted season,k2=1.3 2.5 (sd) 2.0 1.5 0.6 0.8 1.0 1.2 1.4 16 1g(s) Fig.6.Log-log plot of the fluctuation function with respect to time step(Ig(F(s))vs.Ig(s))in DFA2 of original and deseasonalized BPI time BPI Analysis with DFA2 Fig.7 exhibits the result of DFA2 test of BPI time series.The slope of the fitting line means the corresponding scaling exponent a.Obviously,fluctuation function F(s)and time step s present strong logarithmic linear correlation.The scaling exponent a,as defined from the slopes of linear fits to these points,were determined as 1.28,indicating a relatively strong long-range correlation in BPI time series.Since a>0.5, positive long-range correlation can be detected in BPL,which means that persistence exists in volatility of Panamax freight rate market in the range from July Ist,2005 to February 26th,2015. 88 deseasonalization. Nevertheless, the difference between them is small, revealing that the impact of seasonality on BPI series is negligible. What’s more, deseasonalization in this method should be based on monthly mean data, which may bring about the reduction of available data. Due to these two reasons, influence of seasonality isn’t taken into consideration in the following analysis. 0.6 0.8 1.0 1.2 1.4 1.6 1.5 2.0 2.5 3.0 lg(Fs) lg(s) origin series, k1=1.2 series deleted season, k2=1.3 The season influence of BPI Fig. 6. Log-log plot of the fluctuation function with respect to time step ( lg( ( )) F s vs. lg( )s ) in DFA2 of original and deseasonalized BPI time BPI Analysis with DFA2 Fig. 7 exhibits the result of DFA2 test of BPI time series. The slope of the fitting line means the corresponding scaling exponent . Obviously, fluctuation function F s( ) and time step s present strong logarithmic linear correlation. The scaling exponent , as defined from the slopes of linear fits to these points, were determined as 1.28, indicating a relatively strong long-range correlation in BPI time series. Since 0.5, positive long-range correlation can be detected in BPI, which means that persistence exists in volatility of Panamax freight rate market in the range from July 1st, 2005 to February 26th, 2015