正在加载图片...
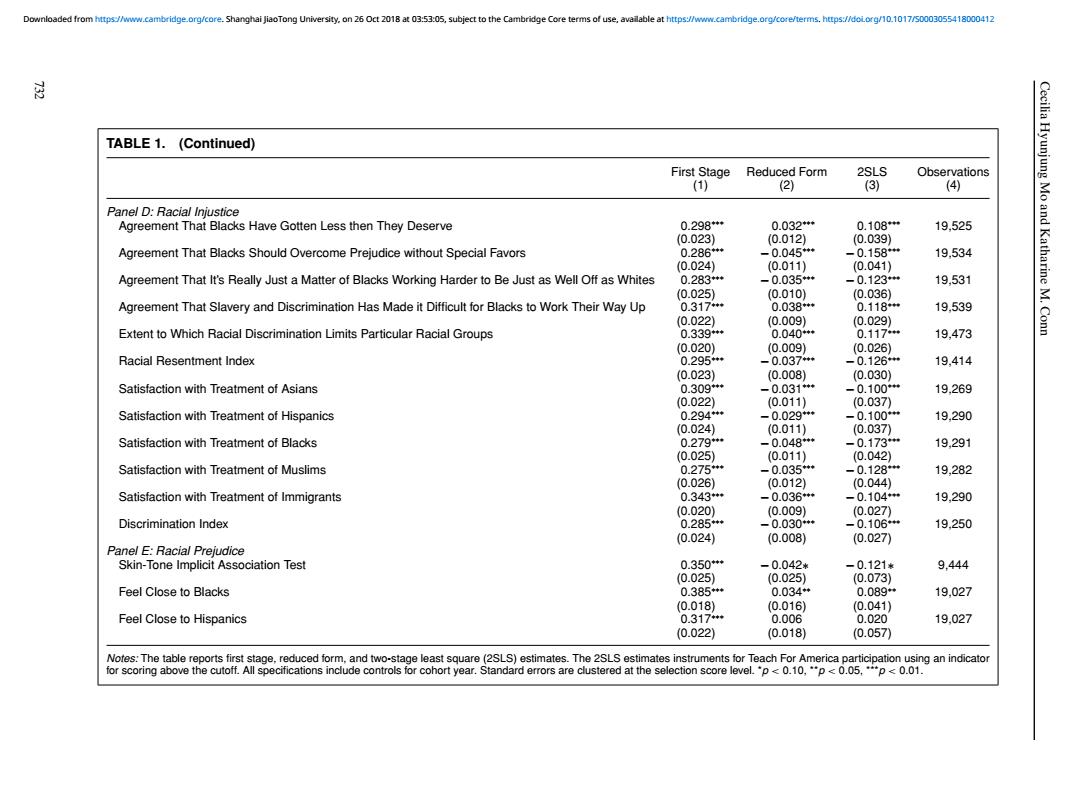
过 TABLE 1.(Continued) Cecilia Hyunj First Stage Reduced Form 2SLS Observations (1) (2) (3) (4) Panel D:Racial Injustice Agreement That Blacks Have Gotten Less then They Deserve 0.298* 0.032** 0.108 and 19,525 (0.023) (0.012) (0.039) Agreement That Blacks Should Overcome Prejudice without Special Favors 0.286* -0.045* -0.158 19,534 (0.024) (0.011) (0.041) arin Agreement That It's Really Just a Matter of Blacks Working Harder to Be Just as Well Off as Whites 0.283* -0.035* -0.123* 19,531 (0.025) (0.010) (0.036) Agreement That Slavery and Discrimination Has Made it Difficult for Blacks to Work Their Way Up 0.317** 0.038*+ 0.118 19,539 (0.022) (0.009) (0.029) Extent to Which Racial Discrimination Limits Particular Racial Groups 0.339* 0.040*+ 0.117* 19.473 (0.020) (0.009) (0.026) Racial Resentment Index 0.295* -0.037** -0.126* 19,414 (0.023) (0.008) (0.030) Satisfaction with Treatment of Asians 0.309* -0.031*+ -0.100* 19.269 (0.022) (0.011) (0.037) Satisfaction with Treatment of Hispanics 0.294* -0.029* -0.100" 19,290 (0.024) (0.011) (0.037 Satisfaction with Treatment of Blacks 0.279* -0.048*+ -0.173" 19,291 (0.025) (0.011) (0.042) Satisfaction with Treatment of Muslims 0.275* -0.035** -0.128# 19,282 (0.026) (0.012) (0.044) Satisfaction with Treatment of Immigrants 0.343*+ -0.036* -0.104* 19.290 (0.020) (0.009) (0.027) Discrimination Index 0.285** -0.030* -0.106* 19.250 (0.024) (0.008) (0.027) Panel E:Racial Prejudice Skin-Tone Implicit Association Test 0.350* -0.042* -0.121* 9,444 (0.025) (0.025) (0.073) Feel Close to Blacks 0.385** 0.034* 0.089* 19,027 (0.018) (0.016) (0.041) Feel Close to Hispanics 0.317** 0.006 0.020 19.027 (0.022) (0.018) (0.057) Nofes:The table reports first stage,reduced form,and two-stage least square(2SLS)estimates.The 2SLS estimates instruments for Teach For America participation using an indicator for scoring above the cutoff.All specifications include controls for cohort year.Standard errors are clustered at the selection score level."p 0.10,"p 0.05,*p<0.01.Cecilia Hyunjung Mo and Katharine M. Conn TABLE 1. (Continued) First Stage Reduced Form 2SLS Observations (1) (2) (3) (4) Panel D: Racial Injustice Agreement That Blacks Have Gotten Less then They Deserve 0.298∗∗∗ 0.032∗∗∗ 0.108∗∗∗ 19,525 (0.023) (0.012) (0.039) Agreement That Blacks Should Overcome Prejudice without Special Favors 0.286∗∗∗ − 0.045∗∗∗ − 0.158∗∗∗ 19,534 (0.024) (0.011) (0.041) Agreement That It’s Really Just a Matter of Blacks Working Harder to Be Just as Well Off as Whites 0.283∗∗∗ − 0.035∗∗∗ − 0.123∗∗∗ 19,531 (0.025) (0.010) (0.036) Agreement That Slavery and Discrimination Has Made it Difficult for Blacks to Work Their Way Up 0.317∗∗∗ 0.038∗∗∗ 0.118∗∗∗ 19,539 (0.022) (0.009) (0.029) Extent to Which Racial Discrimination Limits Particular Racial Groups 0.339∗∗∗ 0.040∗∗∗ 0.117∗∗∗ 19,473 (0.020) (0.009) (0.026) Racial Resentment Index 0.295∗∗∗ − 0.037∗∗∗ − 0.126∗∗∗ 19,414 (0.023) (0.008) (0.030) Satisfaction with Treatment of Asians 0.309∗∗∗ − 0.031∗∗∗ − 0.100∗∗∗ 19,269 (0.022) (0.011) (0.037) Satisfaction with Treatment of Hispanics 0.294∗∗∗ − 0.029∗∗∗ − 0.100∗∗∗ 19,290 (0.024) (0.011) (0.037) Satisfaction with Treatment of Blacks 0.279∗∗∗ − 0.048∗∗∗ − 0.173∗∗∗ 19,291 (0.025) (0.011) (0.042) Satisfaction with Treatment of Muslims 0.275∗∗∗ − 0.035∗∗∗ − 0.128∗∗∗ 19,282 (0.026) (0.012) (0.044) Satisfaction with Treatment of Immigrants 0.343∗∗∗ − 0.036∗∗∗ − 0.104∗∗∗ 19,290 (0.020) (0.009) (0.027) Discrimination Index 0.285∗∗∗ − 0.030∗∗∗ − 0.106∗∗∗ 19,250 (0.024) (0.008) (0.027) Panel E: Racial Prejudice Skin-Tone Implicit Association Test 0.350∗∗∗ − 0.042∗ − 0.121∗ 9,444 (0.025) (0.025) (0.073) Feel Close to Blacks 0.385∗∗∗ 0.034∗∗ 0.089∗∗ 19,027 (0.018) (0.016) (0.041) Feel Close to Hispanics 0.317∗∗∗ 0.006 0.020 19,027 (0.022) (0.018) (0.057) Notes: The table reports first stage, reduced form, and two-stage least square (2SLS) estimates. The 2SLS estimates instruments for Teach For America participation using an indicator for scoring above the cutoff. All specifications include controls for cohort year. Standard errors are clustered at the selection score level. *p < 0.10, **p < 0.05, ***p < 0.01. 732 Downloaded from https://www.cambridge.org/core. Shanghai JiaoTong University, on 26 Oct 2018 at 03:53:05, subject to the Cambridge Core terms of use, available at https://www.cambridge.org/core/terms. https://doi.org/10.1017/S0003055418000412