正在加载图片...

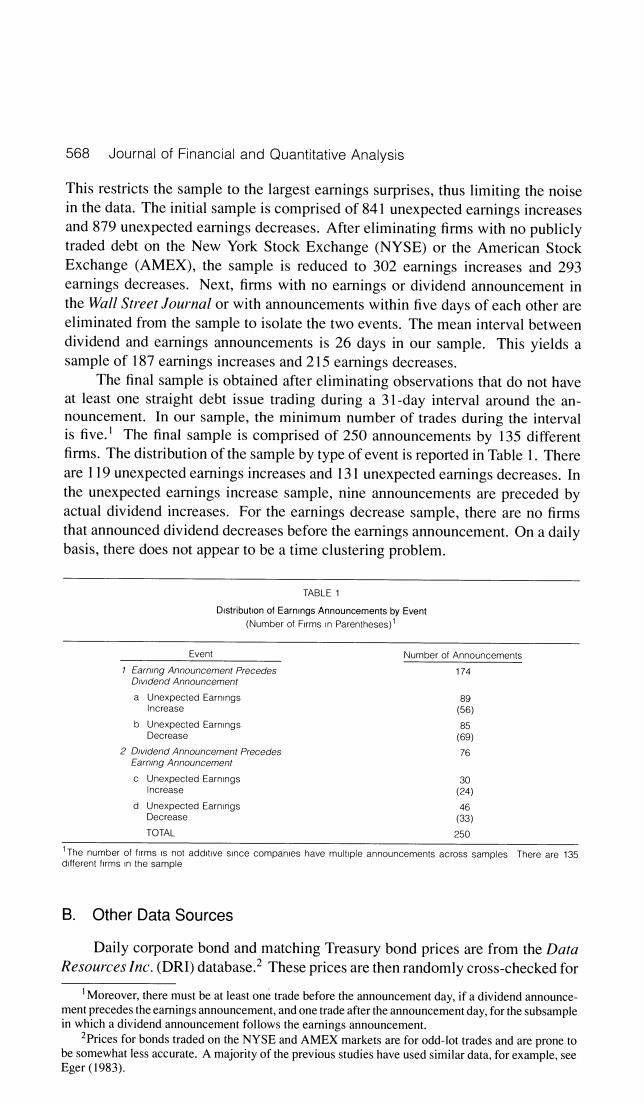
568 Journal of Financial and Quantitative Analysis This restricts the sample to the largest earnings surprises,thus limiting the noise in the data.The initial sample is comprised of 841 unexpected earnings increases and 879 unexpected earnings decreases.After eliminating firms with no publicly traded debt on the New York Stock Exchange (NYSE)or the American Stock Exchange (AMEX),the sample is reduced to 302 earnings increases and 293 earnings decreases.Next,firms with no earnings or dividend announcement in the Wall Street Journal or with announcements within five days of each other are eliminated from the sample to isolate the two events.The mean interval between dividend and earnings announcements is 26 days in our sample.This yields a sample of 187 earnings increases and 215 earnings decreases. The final sample is obtained after eliminating observations that do not have at least one straight debt issue trading during a 31-day interval around the an- nouncement.In our sample,the minimum number of trades during the interval is five.!The final sample is comprised of 250 announcements by 135 different firms.The distribution of the sample by type of event is reported in Table 1.There are 119 unexpected earnings increases and 13I unexpected earnings decreases.In the unexpected earnings increase sample,nine announcements are preceded by actual dividend increases.For the earnings decrease sample,there are no firms that announced dividend decreases before the earnings announcement.On a daily basis,there does not appear to be a time clustering problem. TABLE 1 Distribution of Earnings Announcements by Event (Number of Firms in Parentheses) Event Number of Anncuncements 1 Earning Announcement Precedes 174 Dividend Announcerent a Unexpected Earnings 89 Increase (56) b Unexpected Earnings 85 Decrease (69) 2 Dividend Announcement Precedes 76 Earrng Announcement c Unexpected Earnings 30 (241 d Unexpected Earnings Decrease TOTAL 250 1The number of firms is not additive since companies have multiple announcements across samples There are 135 ditferent firms in the sample B. Other Data Sources Daily corporate bond and matching Treasury bond prices are from the Data Resources Inc.(DRI)database.2 These prices are then randomly cross-checked for Moreover,there must be at least one trade before the announcement day,if a dividend announce- ment precedes the earnings announcement,and one trade after the announcement day,for the subsample in which a dividend announcement follows the earnings announcement. 2Prices for bonds traded on the NYSE and AMEX markets are for odd-lot trades and are prone to be somewhat less accurate.A majority of the previous studies have used similar data,for example,see Eger(1983)