正在加载图片...
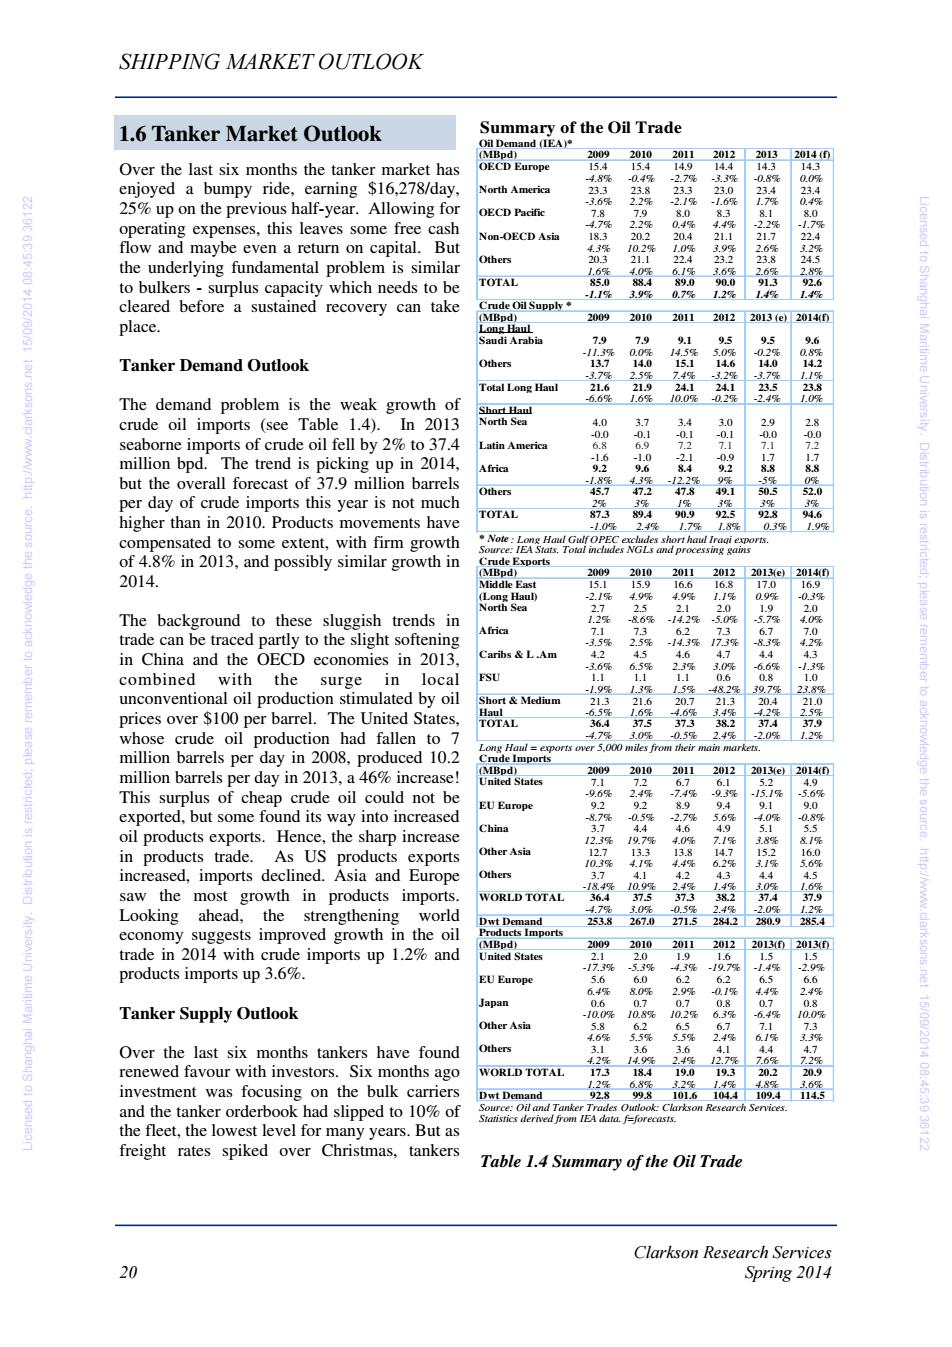
SHIPPING MARKET OUTLOOK 1.6 Tanker Market Outlook Summary of the Oil Trade 2009 2010 Over the last six months the tanker market has OECD Europe 15.4 0.4 enjoyed a bumpy ride,earning $16,278/day, 33% 0.0% North America 255 25%up on the previous half-year.Allowing for 3.6 OECD Pacific 7.8 7.9 8.0 83 operating expenses,this leaves some free cash 4.7% 2.2% 0.4% 4.4 NonOECD Asia 183 20.2 20.4 21.1 21.7 flow and maybe even a return on capital.But 4量 10.2% Others 20.3 21.1 the underlying fundamental problem is similar 1.6 6.1% 3.6% 26% 2.8% to bulkers-surplus capacity which needs to be TOTAL 85.0 4.0 89.0 90.0 913 92.6 11% 3.9% 0.7% 1.2% 1.4% 1.4% #10216031 cleared before a sustained recovery can take Crude Oil Supply◆ 2009 2010 2011 2012 2013(e) 20140 place udi Arabia 7.9 7.9 9.1 9.5 Tanker Demand Outlook -3.7 2.5% 7.4% 5.9 Total Long Haul 21.6 21.9 24.1 24.1 235 23.8 Licensed to Shanghai Maritime University The demand problem is the weak growth of -6.6% 1.6% 10.0% -0.2死 -2.4 1.0% Short Haul crude oil imports (see Table 1.4).In 2013 North Sea 40 1 3.4 3.0 .0 -0. seaborne imports of crude oil fell by 2%to 37.4 Latin America 6.8 6.9 million bpd.The trend is picking up in 2014, -1.6 -1.0 -2.1 Africa 9.2 9.6 8.4 5 but the overall forecast of 37.9 million barrels 1229 3102医 Others 472 478 per day of crude imports this year is not much TOTAL higher than in 2010.Products movements have 2.4% 17 1.8% 0.3% 1.9% compensated to some extent,with firm growth Note:Long Haul GulfOPEC excludes short haul Iraqi exports. Source:IEA Stats.Total includes NGLs and processing gains of 4.8%in 2013,and possibly similar growth in Crude Exports 2014. (MBpd) 2009 2010 2011 2012 2013e) 20140 Middle East 15.1 15.9 16.6 16.8 17.0 16.9 (Long HauD 2I% 4.9% 4.9% 1.1% 0.9% -0.3% plea North Sea 2.7 2.5 2.1 1.9 2.0 The background to these sluggish trends in 1.2% 86% 142% 5.7% 4.0% Africa 71 7.3 6.2 73 trade can be traced partly to the slight softening .15% 25% 14.3% in China and the OECD economies in 2013, Caribs L.Am 4.4 4.3 combined with the surge in local FSU unconventional oil production stimulated by oil 1.9% 2 39.79 23.8% Short Medium 213 21.6 20.7 21.3 20.4 21.0 prices over $100 per barrel.The United States, Haul remember to acknow TOTAL whose crude oil production had fallen to 7 4.70 3.0元 -0.5% 2.490 -20 26 Long Haul exports over 5.000 miles from their main markets. million barrels per day in 2008,produced 10.2 Crude Imports million barrels per day in 2013,a 46%increase! (MBod) 2009 2010 2011 2012 2013e 2014(0 United States 7.1 7.2 5.2 This surplus of cheap crude oil could not be 9.6% 2.4% 15.1% 5.6% EU Europe 9.2 exported,but some found its way into increased 05g China 4.4 the sourde. oil products exports.Hence,the sharp increase in products trade.As US products exports Other Asia increased,imports declined.Asia and Europe Others 3.7 4.1 saw the most growth in products imports. WORLD TOTAL 19器 器 Looking ahead,the strengthening world 4.7% 3.0% Dwt Demand 253.8 267.0 器 器 economy suggests improved growth in the oil Products Imports (MBDd) 2009 2010 2012 20130 2013(f) trade in 2014 with crude imports up 1.2%and 2011 United States 2.1 2.0 1.9 1.5 products imports up 3.6%. 173% 5.3 43% 2.9% EU Europe 5.6 64% Tanker Supply Outlook -o Other Asia 5.8 4.69 Over the last six months tankers have found Others 3.1 3.6 3.6 4.2毫 14.9% 2.49% renewed favour with investors.Six months ago WORLD TOTAL 173 18.4 19.0 19.3 益 investment was focusing on the bulk carriers 1.2% 6.8% 32% http://ww.clarksons.net 15/09/2014 08:45:39 36122 o]pas Dwt Demand 928 99.8 and the tanker orderbook had slipped to 10%of Source:Oil and Tanker Trades Outlook:Clarkson Research Services. Statistics derived from IEA data.f=forecasts. the fleet,the lowest level for many years.But as freight rates spiked over Christmas,tankers Table 1.4 Summary of the Oil Trade Clarkson Research Services 20 Spring 2014Clarkson Research Services 20 Spring 2014 SHIPPING MARKET OUTLOOK Over the last six months the tanker market has enjoyed a bumpy ride, earning $16,278/day, 25% up on the previous half-year. Allowing for operating expenses, this leaves some free cash flow and maybe even a return on capital. But the underlying fundamental problem is similar to bulkers - surplus capacity which needs to be cleared before a sustained recovery can take place. Tanker Demand Outlook The demand problem is the weak growth of crude oil imports (see Table 1.4). In 2013 seaborne imports of crude oil fell by 2% to 37.4 million bpd. The trend is picking up in 2014, but the overall forecast of 37.9 million barrels per day of crude imports this year is not much higher than in 2010. Products movements have compensated to some extent, with firm growth of 4.8% in 2013, and possibly similar growth in 2014. The background to these sluggish trends in trade can be traced partly to the slight softening in China and the OECD economies in 2013, combined with the surge in local unconventional oil production stimulated by oil prices over $100 per barrel. The United States, whose crude oil production had fallen to 7 million barrels per day in 2008, produced 10.2 million barrels per day in 2013, a 46% increase! This surplus of cheap crude oil could not be exported, but some found its way into increased oil products exports. Hence, the sharp increase in products trade. As US products exports increased, imports declined. Asia and Europe saw the most growth in products imports. Looking ahead, the strengthening world economy suggests improved growth in the oil trade in 2014 with crude imports up 1.2% and products imports up 3.6%. Tanker Supply Outlook Over the last six months tankers have found renewed favour with investors. Six months ago investment was focusing on the bulk carriers and the tanker orderbook had slipped to 10% of the fleet, the lowest level for many years. But as freight rates spiked over Christmas, tankers 1.6 Tanker Market Outlook Table 1.4 Summary of the Oil Trade Summary of the Oil Trade Oil Demand (IEA)* (MBpd) 2009 2010 2011 2012 2013 2014 (f) OECD Europe 15.4 15.4 14.9 14.4 14.3 14.3 -4.8% -0.4% -2.7% -3.3% -0.8% 0.0% North America 23.3 23.8 23.3 23.0 23.4 23.4 -3.6% 2.2% -2.1% -1.6% 1.7% 0.4% OECD Pacific 7.8 7.9 8.0 8.3 8.1 8.0 -4.7% 2.2% 0.4% 4.4% -2.2% -1.7% Non-OECD Asia 18.3 20.2 20.4 21.1 21.7 22.4 4.3% 10.2% 1.0% 3.9% 2.6% 3.2% Others 20.3 21.1 22.4 23.2 23.8 24.5 1.6% 4.0% 6.1% 3.6% 2.6% 2.8% TOTAL 85.0 88.4 89.0 90.0 91.3 92.6 -1.1% 3.9% 0.7% 1.2% 1.4% 1.4% Crude Oil Supply * (MBpd) 2009 2010 2011 2012 2013 (e) 2014(f) Long Haul Saudi Arabia 7.9 7.9 9.1 9.5 9.5 9.6 -11.3% 0.0% 14.5% 5.0% -0.2% 0.8% Others 13.7 14.0 15.1 14.6 14.0 14.2 -3.7% 2.5% 7.4% -3.2% -3.7% 1.1% Total Long Haul 21.6 21.9 24.1 24.1 23.5 23.8 -6.6% 1.6% 10.0% -0.2% -2.4% 1.0% Short Haul North Sea 4.0 3.7 3.4 3.0 2.9 2.8 -0.0 -0.1 -0.1 -0.1 -0.0 -0.0 Latin America 6.8 6.9 7.2 7.1 7.1 7.2 -1.6 -1.0 -2.1 -0.9 1.7 1.7 Africa 9.2 9.6 8.4 9.2 8.8 8.8 -1.8% 4.3% -12.2% 9% -5% 0% Others 45.7 47.2 47.8 49.1 50.5 52.0 2% 3% 1% 3% 3% 3% TOTAL 87.3 89.4 90.9 92.5 92.8 94.6 -1.0% 2.4% 1.7% 1.8% 0.3% 1.9% * Note : Long Haul Gulf OPEC excludes short haul Iraqi exports. Source: IEA Stats. Total includes NGLs and processing gains Crude Exports (MBpd) 2009 2010 2011 2012 2013(e) 2014(f) Middle East 15.1 15.9 16.6 16.8 17.0 16.9 (Long Haul) -2.1% 4.9% 4.9% 1.1% 0.9% -0.3% North Sea 2.7 2.5 2.1 2.0 1.9 2.0 1.2% -8.6% -14.2% -5.0% -5.7% 4.0% Africa 7.1 7.3 6.2 7.3 6.7 7.0 -3.5% 2.5% -14.3% 17.3% -8.3% 4.2% Caribs & L .Am 4.2 4.5 4.6 4.7 4.4 4.3 -3.6% 6.5% 2.3% 3.0% -6.6% -1.3% FSU 1.1 1.1 1.1 0.6 0.8 1.0 -1.9% 1.3% 1.5% -48.2% 39.7% 23.8% Short & Medium 21.3 21.6 20.7 21.3 20.4 21.0 Haul -6.5% 1.6% -4.6% 3.4% -4.2% 2.5% TOTAL 36.4 37.5 37.3 38.2 37.4 37.9 -4.7% 3.0% -0.5% 2.4% -2.0% 1.2% Long Haul = exports over 5,000 miles from their main markets. Crude Imports (MBpd) 2009 2010 2011 2012 2013(e) 2014(f) United States 7.1 7.2 6.7 6.1 5.2 4.9 -9.6% 2.4% -7.4% -9.3% -15.1% -5.6% EU Europe 9.2 9.2 8.9 9.4 9.1 9.0 -8.7% -0.5% -2.7% 5.6% -4.0% -0.8% China 3.7 4.4 4.6 4.9 5.1 5.5 12.3% 19.7% 4.0% 7.1% 3.8% 8.1% Other Asia 12.7 13.3 13.8 14.7 15.2 16.0 10.3% 4.1% 4.4% 6.2% 3.1% 5.6% Others 3.7 4.1 4.2 4.3 4.4 4.5 -18.4% 10.9% 2.4% 1.4% 3.0% 1.6% WORLD TOTAL 36.4 37.5 37.3 38.2 37.4 37.9 -4.7% 3.0% -0.5% 2.4% -2.0% 1.2% Dwt Demand 253.8 267.0 271.5 284.2 280.9 285.4 Products Imports (MBpd) 2009 2010 2011 2012 2013(f) 2013(f) United States 2.1 2.0 1.9 1.6 1.5 1.5 -17.3% -5.3% -4.3% -19.7% -1.4% -2.9% EU Europe 5.6 6.0 6.2 6.2 6.5 6.6 6.4% 8.0% 2.9% -0.1% 4.4% 2.4% Japan 0.6 0.7 0.7 0.8 0.7 0.8 -10.0% 10.8% 10.2% 6.3% -6.4% 10.0% Other Asia 5.8 6.2 6.5 6.7 7.1 7.3 4.6% 5.5% 5.5% 2.4% 6.1% 3.3% Others 3.1 3.6 3.6 4.1 4.4 4.7 4.2% 14.9% 2.4% 12.7% 7.6% 7.2% WORLD TOTAL 17.3 18.4 19.0 19.3 20.2 20.9 1.2% 6.8% 3.2% 1.4% 4.8% 3.6% Dwt Demand 92.8 99.8 101.6 104.4 109.4 114.5 Source: Oil and Tanker Trades Outlook: Clarkson Research Services. Statistics derived from IEA data. f=forecasts. Licensed to Shanghai Maritime University. Distribution is restricted; please remember to acknowledge the source. http://www.clarksons.net 15/09/2014 08:45:39 36122 Licensed to Shanghai Maritime University. Distribution is restricted; please remember to acknowledge the source. http://www.clarksons.net 15/09/2014 08:45:39 36122