正在加载图片...
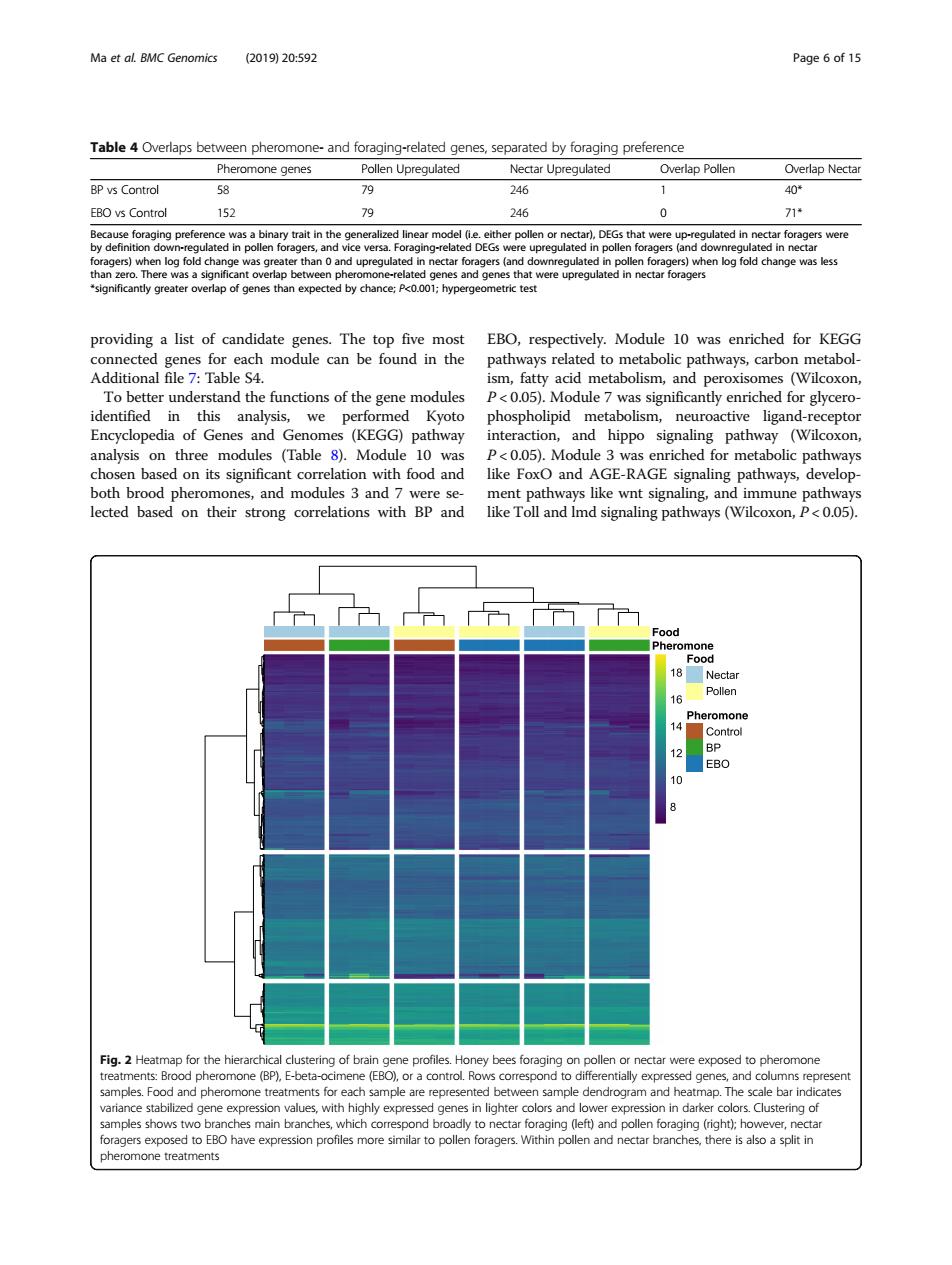
Ma et al BMC Genomics (201920:592 Page of 15 Table 4 Overlaps between pheromone-and foraging-related genes,separated by foraging preference Pheromone genes Pollen Upregulated Nectar Upregulated Overlap Pollen Overlap Nectar BP vs Control 58 246 40 EBO vs Control 46 0 ersac linear model c polen forgers and ownreged n re ulated in po antly greater werlap of genes than expected by chance:P<0.001:hypergeometric tes mo nways,ca To better understand the functions of the gene modules 05)for ger identified in this analysis,we performed phospholipid metabolism,neuroactiv od pathway n M path relation with food and like FoxO and AGE-RAGEian both brood pheromones,and modules 3 and 7 were se nent pathw ys like wnt signaling,and immune pathways lected based on their strong correlations with BP and like Toll and Imd signaling pathways(Wilcoxon,P<0.05). ood 10 Fig.2 Heatmap for the hie nectar were exposed to pheromone amples.Food an nple are represente ate pheromone treatmentsproviding a list of candidate genes. The top five most connected genes for each module can be found in the Additional file 7: Table S4. To better understand the functions of the gene modules identified in this analysis, we performed Kyoto Encyclopedia of Genes and Genomes (KEGG) pathway analysis on three modules (Table 8). Module 10 was chosen based on its significant correlation with food and both brood pheromones, and modules 3 and 7 were selected based on their strong correlations with BP and EBO, respectively. Module 10 was enriched for KEGG pathways related to metabolic pathways, carbon metabolism, fatty acid metabolism, and peroxisomes (Wilcoxon, P < 0.05). Module 7 was significantly enriched for glycerophospholipid metabolism, neuroactive ligand-receptor interaction, and hippo signaling pathway (Wilcoxon, P < 0.05). Module 3 was enriched for metabolic pathways like FoxO and AGE-RAGE signaling pathways, development pathways like wnt signaling, and immune pathways like Toll and lmd signaling pathways (Wilcoxon, P < 0.05). Table 4 Overlaps between pheromone- and foraging-related genes, separated by foraging preference Pheromone genes Pollen Upregulated Nectar Upregulated Overlap Pollen Overlap Nectar BP vs Control 58 79 246 1 40* EBO vs Control 152 79 246 0 71* Because foraging preference was a binary trait in the generalized linear model (i.e. either pollen or nectar), DEGs that were up-regulated in nectar foragers were by definition down-regulated in pollen foragers, and vice versa. Foraging-related DEGs were upregulated in pollen foragers (and downregulated in nectar foragers) when log fold change was greater than 0 and upregulated in nectar foragers (and downregulated in pollen foragers) when log fold change was less than zero. There was a significant overlap between pheromone-related genes and genes that were upregulated in nectar foragers *significantly greater overlap of genes than expected by chance; P<0.001; hypergeometric test Fig. 2 Heatmap for the hierarchical clustering of brain gene profiles. Honey bees foraging on pollen or nectar were exposed to pheromone treatments: Brood pheromone (BP), E-beta-ocimene (EBO), or a control. Rows correspond to differentially expressed genes, and columns represent samples. Food and pheromone treatments for each sample are represented between sample dendrogram and heatmap. The scale bar indicates variance stabilized gene expression values, with highly expressed genes in lighter colors and lower expression in darker colors. Clustering of samples shows two branches main branches, which correspond broadly to nectar foraging (left) and pollen foraging (right); however, nectar foragers exposed to EBO have expression profiles more similar to pollen foragers. Within pollen and nectar branches, there is also a split in pheromone treatments Ma et al. BMC Genomics (2019) 20:592 Page 6 of 15