正在加载图片...
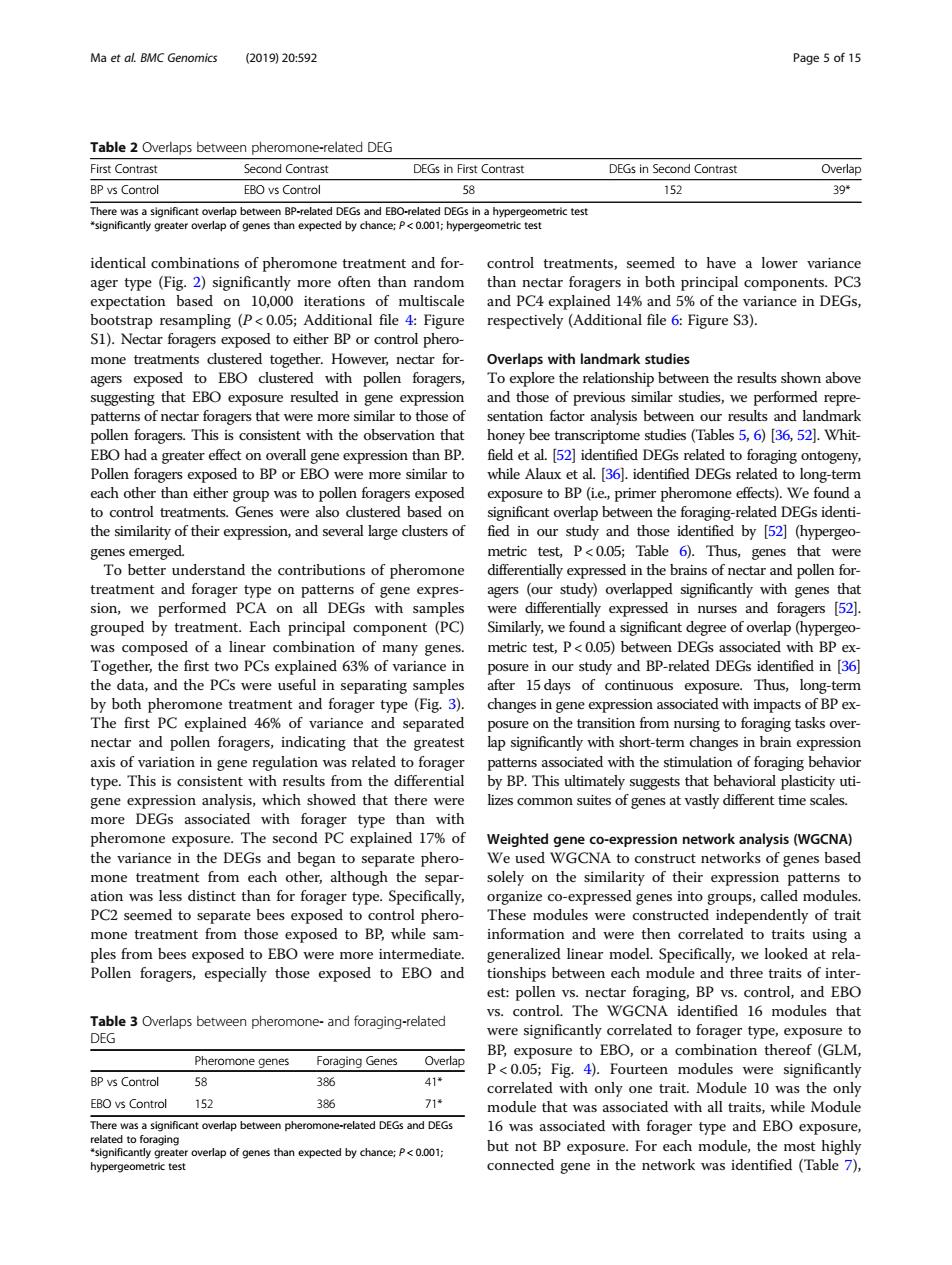
Ma et aL BMC Genomics 201920:592 Page 5 of 15 Table 2Overlaps between pheromone-related DEG tric tes and for ager type (Fig.2)significantly more often than random than nectar foragers in both princ expectation based on 10,000 ite ampling (P 上gur Overlaps with landmark studies d to EBO dustered with pollen foragers To explore the relationship between the results shown above and those of previous similar studies,we performed repre Whi EBO had than BP field et al 52]identified DEGs related to fo Pollen fora sed to BP or EBO were more similar to while Alaux et al.3).identificd DEGs related each other d of their e nd thos s emerged metric test p<005:Table 6)Thus eenes that wer To better understand the contributions of pheromone differentially expressed in the brains of nectar and pollen for treatment and forager the expre gers significantly wit genes inal com Similarly.we found a si nificant de sed of a linear combination of many genes. metrictest P)between DEGs associated with BPx a and the PC were use 15 days of continuous expos ing tasks o nectar and pollen foragers,indicating that the greatest lap significantly with short-term changes in brain expression axis of variation in gene regulation was rela to forager ated with the stimulatio n of foraging behavior type This i t with resu more DEGs associated with forager with pheromone exposure. the variance in the DEGs and Weighted gene co-expression network analysis(WGCNA) egan GCN to cons struct networks of genes based eir express PC2 seemed to separate bees exposed to control phero These module were independe of tra mone treatment from those exposed to BP,while sam- les fro be expose O were more y we looked ragers, est:pollen ys.nectar fo Table 3 Overlaps between pheromone-and foraging-related were significantly coreated to forager type,exposuret pheromone genes raging Genes Overlap BP 005:Fig or a comb orrelated with only one trait.Module 10 was the only 152 module that was ass ciated with all traits,while Module was a si ant overlap between pheror one-related DEGs and DEGs b was associated with forager type and EBO exposu verlap of genes than expected by chance:Pc0.001; identical combinations of pheromone treatment and forager type (Fig. 2) significantly more often than random expectation based on 10,000 iterations of multiscale bootstrap resampling (P < 0.05; Additional file 4: Figure S1). Nectar foragers exposed to either BP or control pheromone treatments clustered together. However, nectar foragers exposed to EBO clustered with pollen foragers, suggesting that EBO exposure resulted in gene expression patterns of nectar foragers that were more similar to those of pollen foragers. This is consistent with the observation that EBO had a greater effect on overall gene expression than BP. Pollen foragers exposed to BP or EBO were more similar to each other than either group was to pollen foragers exposed to control treatments. Genes were also clustered based on the similarity of their expression, and several large clusters of genes emerged. To better understand the contributions of pheromone treatment and forager type on patterns of gene expression, we performed PCA on all DEGs with samples grouped by treatment. Each principal component (PC) was composed of a linear combination of many genes. Together, the first two PCs explained 63% of variance in the data, and the PCs were useful in separating samples by both pheromone treatment and forager type (Fig. 3). The first PC explained 46% of variance and separated nectar and pollen foragers, indicating that the greatest axis of variation in gene regulation was related to forager type. This is consistent with results from the differential gene expression analysis, which showed that there were more DEGs associated with forager type than with pheromone exposure. The second PC explained 17% of the variance in the DEGs and began to separate pheromone treatment from each other, although the separation was less distinct than for forager type. Specifically, PC2 seemed to separate bees exposed to control pheromone treatment from those exposed to BP, while samples from bees exposed to EBO were more intermediate. Pollen foragers, especially those exposed to EBO and control treatments, seemed to have a lower variance than nectar foragers in both principal components. PC3 and PC4 explained 14% and 5% of the variance in DEGs, respectively (Additional file 6: Figure S3). Overlaps with landmark studies To explore the relationship between the results shown above and those of previous similar studies, we performed representation factor analysis between our results and landmark honey bee transcriptome studies (Tables 5, 6) [36, 52]. Whitfield et al. [52] identified DEGs related to foraging ontogeny, while Alaux et al. [36]. identified DEGs related to long-term exposure to BP (i.e., primer pheromone effects). We found a significant overlap between the foraging-related DEGs identified in our study and those identified by [52] (hypergeometric test, P < 0.05; Table 6). Thus, genes that were differentially expressed in the brains of nectar and pollen foragers (our study) overlapped significantly with genes that were differentially expressed in nurses and foragers [52]. Similarly, we found a significant degree of overlap (hypergeometric test, P < 0.05) between DEGs associated with BP exposure in our study and BP-related DEGs identified in [36] after 15 days of continuous exposure. Thus, long-term changes in gene expression associated with impacts of BP exposure on the transition from nursing to foraging tasks overlap significantly with short-term changes in brain expression patterns associated with the stimulation of foraging behavior by BP. This ultimately suggests that behavioral plasticity utilizes common suites of genes at vastly different time scales. Weighted gene co-expression network analysis (WGCNA) We used WGCNA to construct networks of genes based solely on the similarity of their expression patterns to organize co-expressed genes into groups, called modules. These modules were constructed independently of trait information and were then correlated to traits using a generalized linear model. Specifically, we looked at relationships between each module and three traits of interest: pollen vs. nectar foraging, BP vs. control, and EBO vs. control. The WGCNA identified 16 modules that were significantly correlated to forager type, exposure to BP, exposure to EBO, or a combination thereof (GLM, P < 0.05; Fig. 4). Fourteen modules were significantly correlated with only one trait. Module 10 was the only module that was associated with all traits, while Module 16 was associated with forager type and EBO exposure, but not BP exposure. For each module, the most highly connected gene in the network was identified (Table 7), Table 2 Overlaps between pheromone-related DEG First Contrast Second Contrast DEGs in First Contrast DEGs in Second Contrast Overlap BP vs Control EBO vs Control 58 152 39* There was a significant overlap between BP-related DEGs and EBO-related DEGs in a hypergeometric test *significantly greater overlap of genes than expected by chance; P < 0.001; hypergeometric test Table 3 Overlaps between pheromone- and foraging-related DEG Pheromone genes Foraging Genes Overlap BP vs Control 58 386 41* EBO vs Control 152 386 71* There was a significant overlap between pheromone-related DEGs and DEGs related to foraging *significantly greater overlap of genes than expected by chance; P < 0.001; hypergeometric test Ma et al. BMC Genomics (2019) 20:592 Page 5 of 15