正在加载图片...
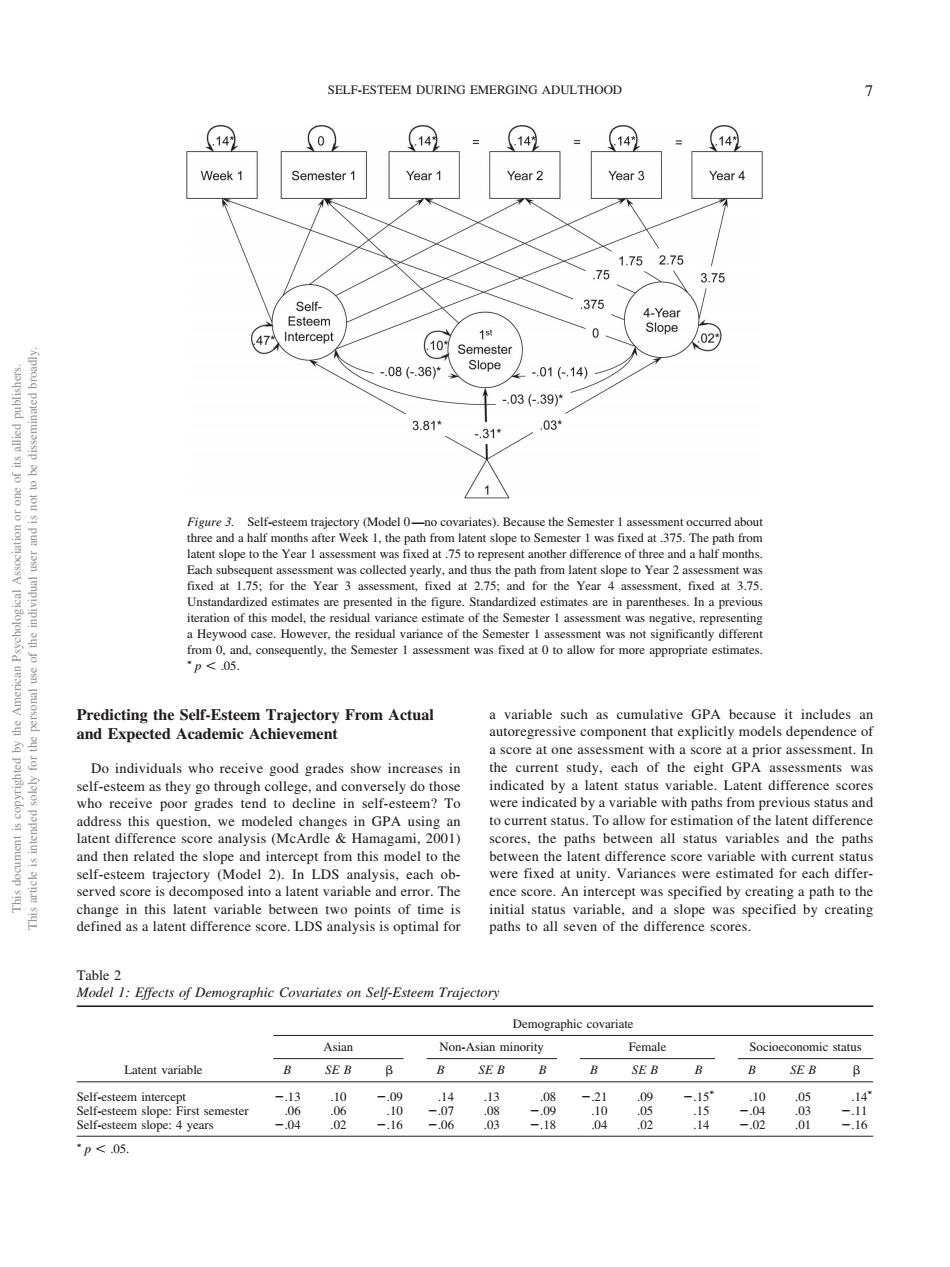
SELF-ESTEEM DURING EMERGING ADULTHOOD 8受奥兴 752.75 3.75 375 -08,36y .01(-.14 -03(-39° 3.81 03 ent slope to e Year 375 ted in the figun are in parenthes s.In an e of th s fixed mo p<05 raject ory From Actual receive poor grades tend to decline in selfe teem?To were ind atent difference score analysis(MeArdle) s and the paths then rela ved scoreisde mposed into a latent error.The score.An intercept was specified by creating a path to the Asian Socioccono SEB 5E& p<05.Predicting the Self-Esteem Trajectory From Actual and Expected Academic Achievement Do individuals who receive good grades show increases in self-esteem as they go through college, and conversely do those who receive poor grades tend to decline in self-esteem? To address this question, we modeled changes in GPA using an latent difference score analysis (McArdle & Hamagami, 2001) and then related the slope and intercept from this model to the self-esteem trajectory (Model 2). In LDS analysis, each observed score is decomposed into a latent variable and error. The change in this latent variable between two points of time is defined as a latent difference score. LDS analysis is optimal for a variable such as cumulative GPA because it includes an autoregressive component that explicitly models dependence of a score at one assessment with a score at a prior assessment. In the current study, each of the eight GPA assessments was indicated by a latent status variable. Latent difference scores were indicated by a variable with paths from previous status and to current status. To allow for estimation of the latent difference scores, the paths between all status variables and the paths between the latent difference score variable with current status were fixed at unity. Variances were estimated for each difference score. An intercept was specified by creating a path to the initial status variable, and a slope was specified by creating paths to all seven of the difference scores. Figure 3. Self-esteem trajectory (Model 0—no covariates). Because the Semester 1 assessment occurred about three and a half months after Week 1, the path from latent slope to Semester 1 was fixed at .375. The path from latent slope to the Year 1 assessment was fixed at .75 to represent another difference of three and a half months. Each subsequent assessment was collected yearly, and thus the path from latent slope to Year 2 assessment was fixed at 1.75; for the Year 3 assessment, fixed at 2.75; and for the Year 4 assessment, fixed at 3.75. Unstandardized estimates are presented in the figure. Standardized estimates are in parentheses. In a previous iteration of this model, the residual variance estimate of the Semester 1 assessment was negative, representing a Heywood case. However, the residual variance of the Semester 1 assessment was not significantly different from 0, and, consequently, the Semester 1 assessment was fixed at 0 to allow for more appropriate estimates. p .05. Table 2 Model 1: Effects of Demographic Covariates on Self-Esteem Trajectory Latent variable Demographic covariate Asian Non-Asian minority Female Socioeconomic status B SE B B SE B B B SE B B B SE B Self-esteem intercept .13 .10 .09 .14 .13 .08 .21 .09 .15 .10 .05 .14 Self-esteem slope: First semester .06 .06 .10 .07 .08 .09 .10 .05 .15 .04 .03 .11 Self-esteem slope: 4 years .04 .02 .16 .06 .03 .18 .04 .02 .14 .02 .01 .16 p .05. This document is copyrighted by the American Psychological Association or one of its allied publishers. This article is intended solely for the personal use of the individual user and is not to be disseminated broadly. SELF-ESTEEM DURING EMERGING ADULTHOOD 7����������������