正在加载图片...
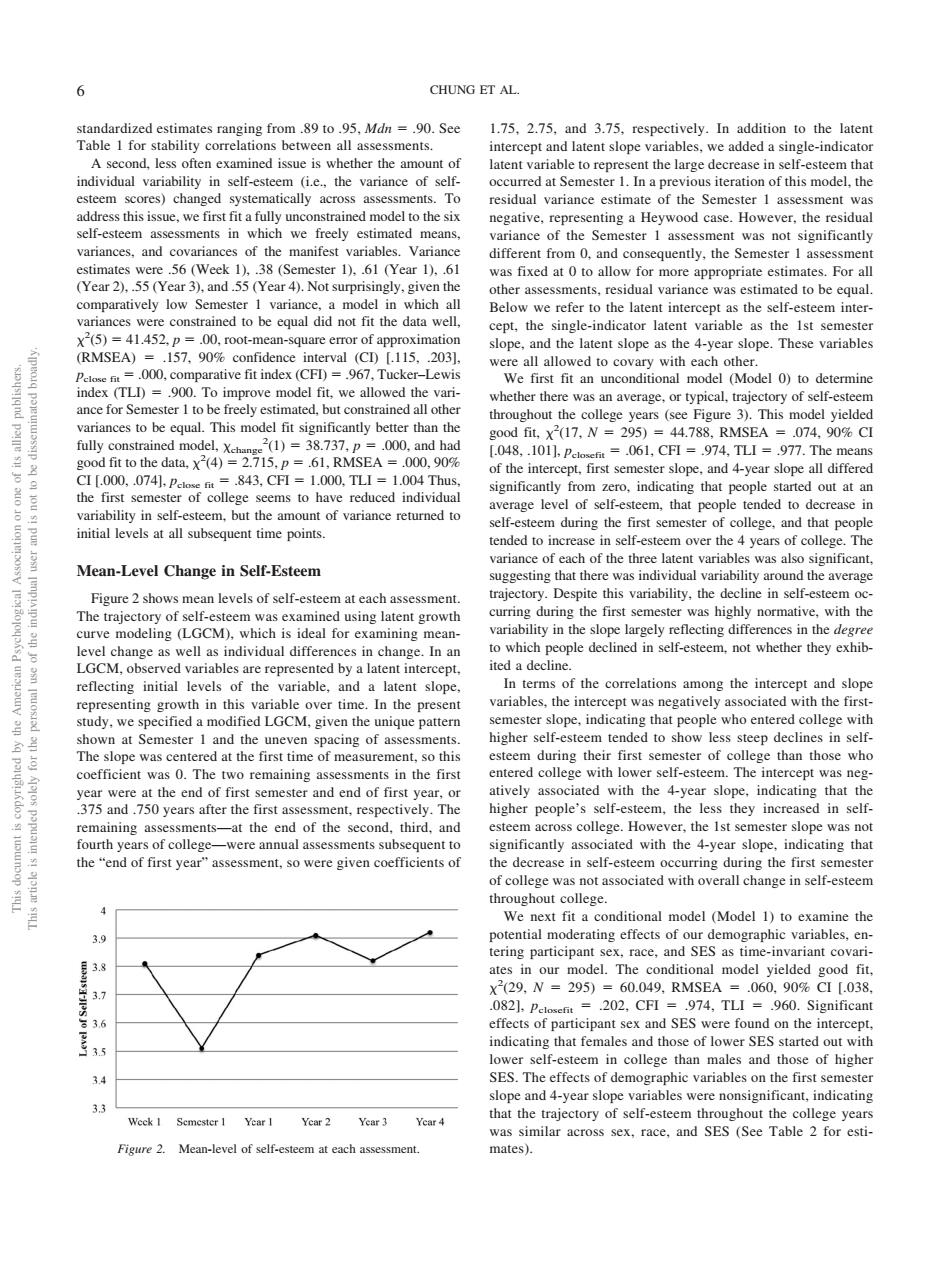
CHUNG ET AL =.90.Sce cond.ss ofen amined isueis whether the amount of sent the large decrease in self-esteem that y self-este riance of adaS s iteration of this model,th dress this issue.we first fit a fullyun strained model to the six negative,representing a Hey od case.However.the residua a model in which all do llop cept.the RMSEA)- .157,9%confidence index(TL)900.To tive fit inc 6 ces to be qual Th mod .000. dfit to the data.(4) =61,RM SEA 00,.90 .061.CFI he first sem ended to increase in self-esteem over the 4 vears of colle Th Mean-Level Change in Self-Esteem Despite this variability,the de inself-esteer norm urve moc ing (LGC al lor exa mining ed variables are repre cept endy.wes Inth slop nd slon ariables.the intercept was negatively lege e than those who The 375 and .750 vears after the first ass ent.respec ively.The higher people'ss-esteem.the le ents-at the end of the second tha the "end of first year"assessment.so were given coefficients of We next fit a conditional model (Model 1)to examine the potent 3. our onditiona model yielded good fit ndicati hat rem started 34 SES.The effects of demo hic variables on the first Ticant indicating 33 Wock I Semester I Year 1 Year 2 Year 3 Year 4 similar across sex.race.and SES (See Table 2 for esti Figure 2.Mean-level of self-esteem at each assessment. mates). standardized estimates ranging from .89 to .95, Mdn .90. See Table 1 for stability correlations between all assessments. A second, less often examined issue is whether the amount of individual variability in self-esteem (i.e., the variance of selfesteem scores) changed systematically across assessments. To address this issue, we first fit a fully unconstrained model to the six self-esteem assessments in which we freely estimated means, variances, and covariances of the manifest variables. Variance estimates were .56 (Week 1), .38 (Semester 1), .61 (Year 1), .61 (Year 2), .55 (Year 3), and .55 (Year 4). Not surprisingly, given the comparatively low Semester 1 variance, a model in which all variances were constrained to be equal did not fit the data well, 2 (5) 41.452, p .00, root-mean-square error of approximation (RMSEA) .157, 90% confidence interval (CI) [.115, .203], pclose fit .000, comparative fit index (CFI) .967, Tucker–Lewis index (TLI) .900. To improve model fit, we allowed the variance for Semester 1 to be freely estimated, but constrained all other variances to be equal. This model fit significantly better than the fully constrained model, change 2 (1) 38.737, p .000, and had good fit to the data, 2 (4) 2.715, p .61, RMSEA .000, 90% CI [.000, .074], pclose fit .843, CFI 1.000, TLI 1.004 Thus, the first semester of college seems to have reduced individual variability in self-esteem, but the amount of variance returned to initial levels at all subsequent time points. Mean-Level Change in Self-Esteem Figure 2 shows mean levels of self-esteem at each assessment. The trajectory of self-esteem was examined using latent growth curve modeling (LGCM), which is ideal for examining meanlevel change as well as individual differences in change. In an LGCM, observed variables are represented by a latent intercept, reflecting initial levels of the variable, and a latent slope, representing growth in this variable over time. In the present study, we specified a modified LGCM, given the unique pattern shown at Semester 1 and the uneven spacing of assessments. The slope was centered at the first time of measurement, so this coefficient was 0. The two remaining assessments in the first year were at the end of first semester and end of first year, or .375 and .750 years after the first assessment, respectively. The remaining assessments—at the end of the second, third, and fourth years of college—were annual assessments subsequent to the “end of first year” assessment, so were given coefficients of 1.75, 2.75, and 3.75, respectively. In addition to the latent intercept and latent slope variables, we added a single-indicator latent variable to represent the large decrease in self-esteem that occurred at Semester 1. In a previous iteration of this model, the residual variance estimate of the Semester 1 assessment was negative, representing a Heywood case. However, the residual variance of the Semester 1 assessment was not significantly different from 0, and consequently, the Semester 1 assessment was fixed at 0 to allow for more appropriate estimates. For all other assessments, residual variance was estimated to be equal. Below we refer to the latent intercept as the self-esteem intercept, the single-indicator latent variable as the 1st semester slope, and the latent slope as the 4-year slope. These variables were all allowed to covary with each other. We first fit an unconditional model (Model 0) to determine whether there was an average, or typical, trajectory of self-esteem throughout the college years (see Figure 3). This model yielded good fit, 2 (17, N 295) 44.788, RMSEA .074, 90% CI [.048, .101], pclosefit .061, CFI .974, TLI .977. The means of the intercept, first semester slope, and 4-year slope all differed significantly from zero, indicating that people started out at an average level of self-esteem, that people tended to decrease in self-esteem during the first semester of college, and that people tended to increase in self-esteem over the 4 years of college. The variance of each of the three latent variables was also significant, suggesting that there was individual variability around the average trajectory. Despite this variability, the decline in self-esteem occurring during the first semester was highly normative, with the variability in the slope largely reflecting differences in the degree to which people declined in self-esteem, not whether they exhibited a decline. In terms of the correlations among the intercept and slope variables, the intercept was negatively associated with the firstsemester slope, indicating that people who entered college with higher self-esteem tended to show less steep declines in selfesteem during their first semester of college than those who entered college with lower self-esteem. The intercept was negatively associated with the 4-year slope, indicating that the higher people’s self-esteem, the less they increased in selfesteem across college. However, the 1st semester slope was not significantly associated with the 4-year slope, indicating that the decrease in self-esteem occurring during the first semester of college was not associated with overall change in self-esteem throughout college. We next fit a conditional model (Model 1) to examine the potential moderating effects of our demographic variables, entering participant sex, race, and SES as time-invariant covariates in our model. The conditional model yielded good fit, 2 (29, N 295) 60.049, RMSEA .060, 90% CI [.038, .082], pclosefit .202, CFI .974, TLI .960. Significant effects of participant sex and SES were found on the intercept, indicating that females and those of lower SES started out with lower self-esteem in college than males and those of higher SES. The effects of demographic variables on the first semester slope and 4-year slope variables were nonsignificant, indicating that the trajectory of self-esteem throughout the college years was similar across sex, race, and SES (See Table 2 for estiFigure 2. Mean-level of self-esteem at each assessment. mates). This document is copyrighted by the American Psychological Association or one of its allied publishers. This article is intended solely for the personal use of the individual user and is not to be disseminated broadly. 6 CHUNG ET AL