正在加载图片...
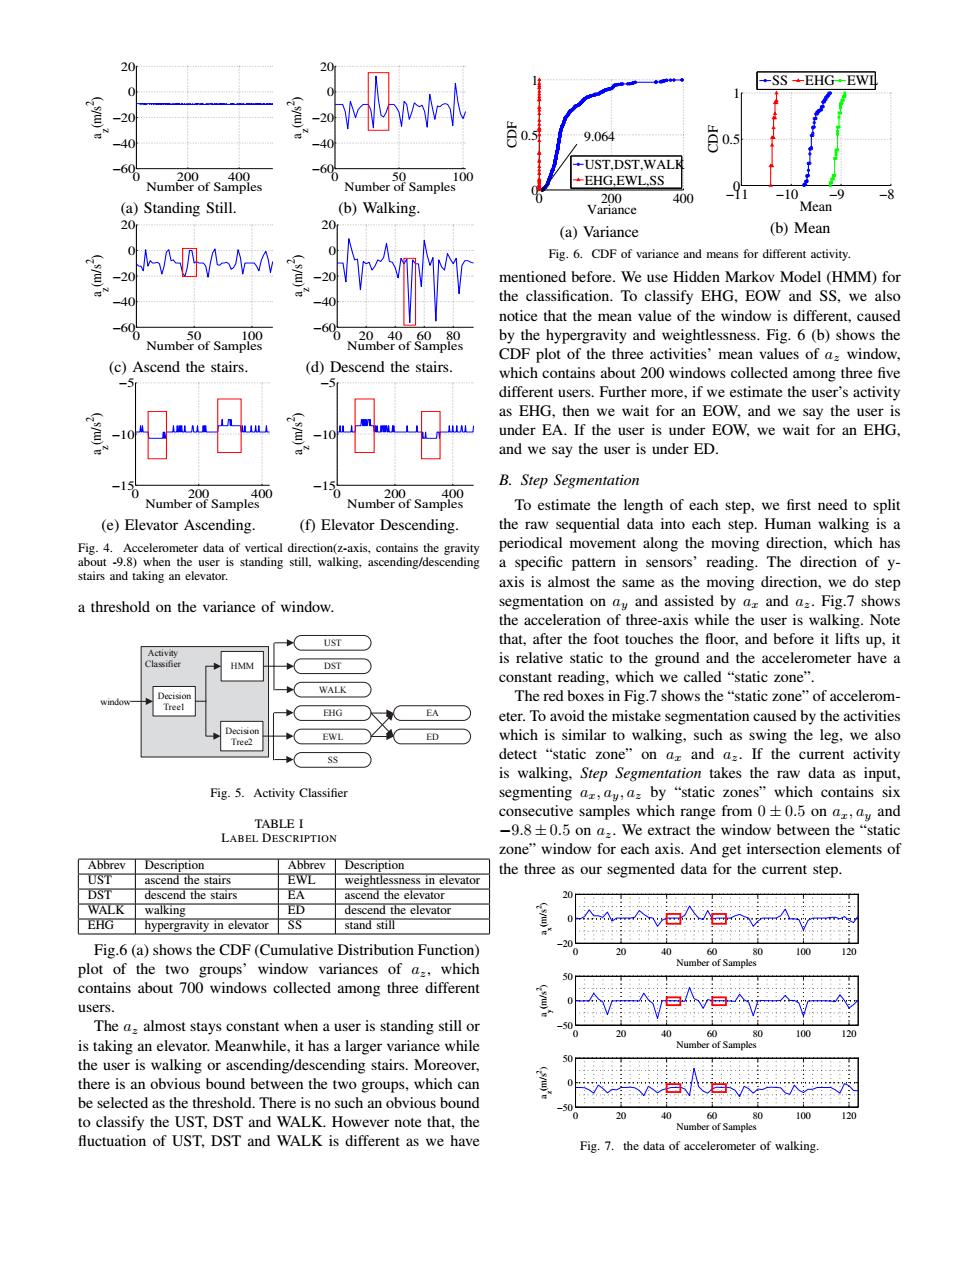
20 wwi SS--EHG-EWL -20 -20 9.064 -40 0.5 60% UST.DST.WALK -0 200 400 50 100 Number of Samples Number of Samples EHG.EWL.SS -10 (a)Standing Still. (b)Walking. Vanmnce 400 Mean 20 20 (a)Variance (b)Mean W Fig.6.CDF of variance and means for different activity -20 mentioned before.We use Hidden Markov Model(HMM)for 4 the classification.To classify EHG,EOW and SS,we also notice that the mean value of the window is different,caused 100 6 by the hypergravity and weightlessness.Fig.6(b)shows the CDF plot of the three activities'mean values of a:window, (c)Ascend the stairs. (d)Descend the stairs which contains about 200 windows collected among three five different users.Further more,if we estimate the user's activity as EHG,then we wait for an EOW,and we say the user is -10 under EA.If the user is under EOW,we wait for an EHG, and we say the user is under ED. B.Step Segmentation Number of Sample00 400 Number of Samples To estimate the length of each step,we first need to split (e)Elevator Ascending. (f)Elevator Descending. the raw sequential data into each step.Human walking is a Fig.4.Accelerometer data of vertical direction(z-axis,contains the gravity periodical movement along the moving direction,which has about -9.8)when the user is standing still,walking.ascending/descending a specific pattern in sensors'reading.The direction of y- stairs and taking an elevator. axis is almost the same as the moving direction,we do step a threshold on the variance of window. segmentation on ay and assisted by ar and a=.Fig.7 shows the acceleration of three-axis while the user is walking.Note UST that,after the foot touches the floor,and before it lifts up,it ●ase HMM DST is relative static to the ground and the accelerometer have a constant reading,which we called "static zone". WALK The red boxes in Fig.7 shows the "static zone"of accelerom- Treel EHG EA eter.To avoid the mistake segmentation caused by the activities Tree2 EWL ED which is similar to walking,such as swing the leg,we also SS detect "static zone"on az and a=.If the current activity is walking,Step Segmentation takes the raw data as input, Fig.5.Activity Classifier segmenting az,ay,a:by "static zones"which contains six consecutive samples which range from 0+0.5 on a,ay and TABLE I LABEL DESCRIPTION -9.8+0.5 on a.We extract the window between the "static zone"window for each axis.And get intersection elements of Abbrev Description Abbrev Description UST EWL the three as our segmented data for the current step. ascend the stairs weightlessness in elevator DST descend the stairs EA ascend the elevator WALK walking ED descend the elevator EHG hypergravity in elevator SS stand still Fig.6(a)shows the CDF(Cumulative Distribution Function) 40 60 100 120 Number of samn plot of the two groups'window variances of a=,which contains about 700 windows collected among three different users. The a:almost stays constant when a user is standing still or 80 100 120 is taking an elevator.Meanwhile,it has a larger variance while Number ot sam the user is walking or ascending/descending stairs.Moreover, there is an obvious bound between the two groups,which can be selected as the threshold.There is no such an obvious bound to classify the UST,DST and WALK.However note that,the 40 60 80 100 120 Number of Sample fluctuation of UST.DST and WALK is different as we have Fig.7.the data of accelerometer of walking.0 200 400 −60 −40 −20 0 20 Number of Samples a z(m/s 2 ) (a) Standing Still. 0 50 100 −60 −40 −20 0 20 Number of Samples a z(m/s 2 ) (b) Walking. 0 50 100 −60 −40 −20 0 20 Number of Samples a z(m/s 2 ) (c) Ascend the stairs. 0 20 40 60 80 −60 −40 −20 0 20 Number of Samples a z(m/s 2 ) (d) Descend the stairs. 0 200 400 −15 −10 −5 Number of Samples a z(m/s 2 ) (e) Elevator Ascending. 0 200 400 −15 −10 −5 Number of Samples a z(m/s 2 ) (f) Elevator Descending. Fig. 4. Accelerometer data of vertical direction(z-axis, contains the gravity about -9.8) when the user is standing still, walking, ascending/descending stairs and taking an elevator. a threshold on the variance of window. window Decision Tree1 HMM Decision Tree2 UST DST WALK SS EHG EWL EA ED Activity Classifier Fig. 5. Activity Classifier TABLE I LABEL DESCRIPTION Abbrev Description Abbrev Description UST ascend the stairs EWL weightlessness in elevator DST descend the stairs EA ascend the elevator WALK walking ED descend the elevator EHG hypergravity in elevator SS stand still Fig.6 (a) shows the CDF (Cumulative Distribution Function) plot of the two groups’ window variances of az, which contains about 700 windows collected among three different users. The az almost stays constant when a user is standing still or is taking an elevator. Meanwhile, it has a larger variance while the user is walking or ascending/descending stairs. Moreover, there is an obvious bound between the two groups, which can be selected as the threshold. There is no such an obvious bound to classify the UST, DST and WALK. However note that, the fluctuation of UST, DST and WALK is different as we have 0 200 400 0 0.5 1 Variance CDF UST,DST,WALK EHG,EWL,SS 9.064 (a) Variance −11 −10 −9 −8 0 0.5 1 Mean CDF SS EHG EWL (b) Mean Fig. 6. CDF of variance and means for different activity. mentioned before. We use Hidden Markov Model (HMM) for the classification. To classify EHG, EOW and SS, we also notice that the mean value of the window is different, caused by the hypergravity and weightlessness. Fig. 6 (b) shows the CDF plot of the three activities’ mean values of az window, which contains about 200 windows collected among three five different users. Further more, if we estimate the user’s activity as EHG, then we wait for an EOW, and we say the user is under EA. If the user is under EOW, we wait for an EHG, and we say the user is under ED. B. Step Segmentation To estimate the length of each step, we first need to split the raw sequential data into each step. Human walking is a periodical movement along the moving direction, which has a specific pattern in sensors’ reading. The direction of yaxis is almost the same as the moving direction, we do step segmentation on ay and assisted by ax and az. Fig.7 shows the acceleration of three-axis while the user is walking. Note that, after the foot touches the floor, and before it lifts up, it is relative static to the ground and the accelerometer have a constant reading, which we called “static zone”. The red boxes in Fig.7 shows the “static zone” of accelerometer. To avoid the mistake segmentation caused by the activities which is similar to walking, such as swing the leg, we also detect “static zone” on ax and az. If the current activity is walking, Step Segmentation takes the raw data as input, segmenting ax, ay, az by “static zones” which contains six consecutive samples which range from 0 ± 0.5 on ax, ay and −9.8 ± 0.5 on az. We extract the window between the “static zone” window for each axis. And get intersection elements of the three as our segmented data for the current step. 0 20 40 60 80 100 120 −20 0 20 Number of Samples a x(m/s 2 ) 0 20 40 60 80 100 120 −50 0 50 Number of Samples a y(m/s 2 ) 0 20 40 60 80 100 120 −50 0 50 Number of Samples a z(m/s 2 ) Fig. 7. the data of accelerometer of walking