正在加载图片...

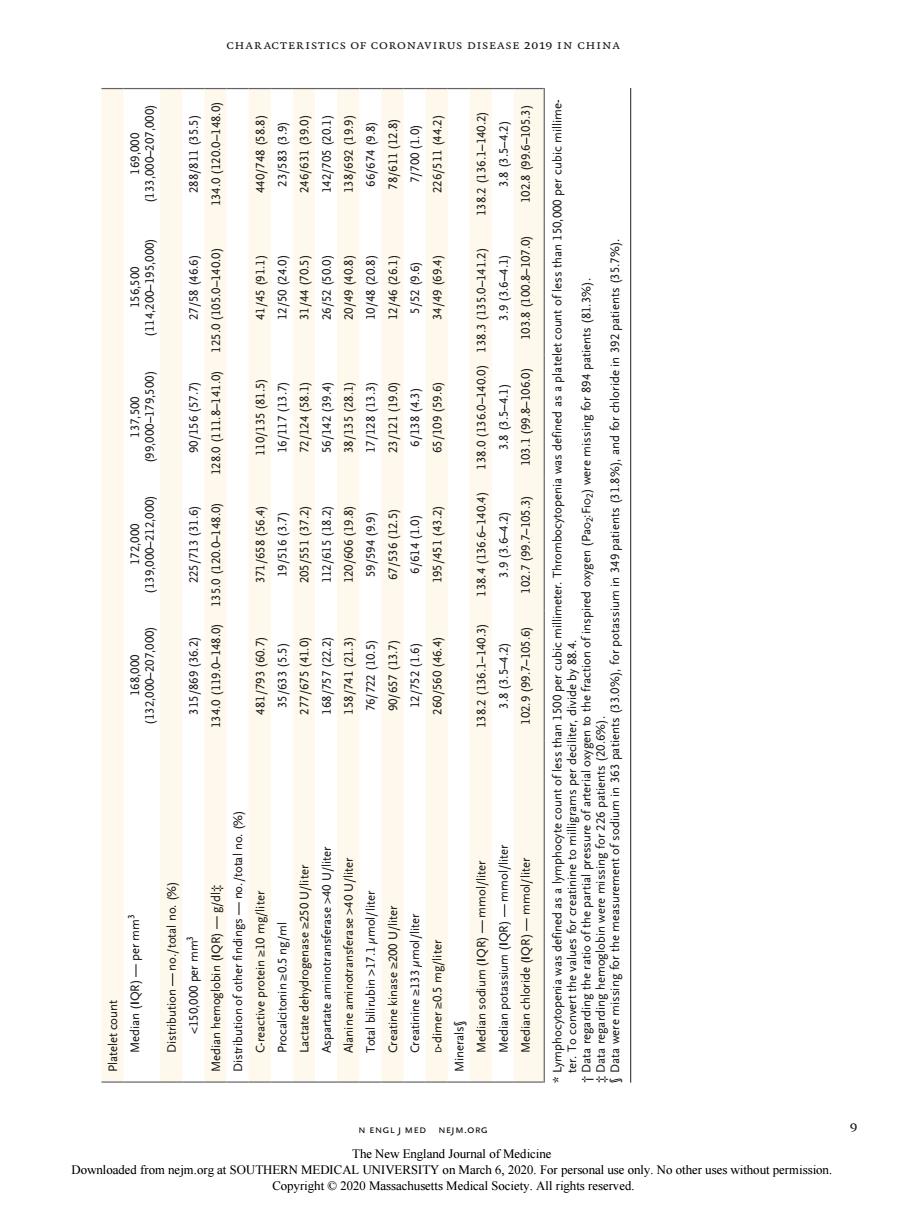
CHARACTERISTICS OF CORONAVIRUS DISEASE 2019 IN CHINA (8'85)8vL/Ov 010000 (50960320 1927 (69)6/ve (ZT-OE) 0:20具8:0008:80 0t811192 (S'T8)SET/OT (Et)/L 060t212 965160750 (04013.66)1:50t DCtne 861-0.021015511081-0.6t)O 5915/65 (oT)t9/9 ()Is/s6T .(5:501/:66k201 9701-7669620 p/-ooway sau puy jayto jo uognq!ns!c /owr t'Lt<uqn oww-wnpos up N ENGLJ MED NEJM.ORC Dow loaded from nejm org at No other uses without permission n engl j med nejm.org 9 Char acteristics of Coronavirus Disease 2019 in China Platelet count Median (IQR) — per mm3 168,000 (132,000–207,000) 172,000 (139,000–212,000) 137,500 (99,000–179,500) 156,500 (114,200–195,000) 169,000 (133,000–207,000) Distribution — no./total no. (%) <150,000 per mm3 315/869 (36.2) 225/713 (31.6) 90/156 (57.7) 27/58 (46.6) 288/811 (35.5) Median hemoglobin (IQR) — g/dl‡ 134.0 (119.0–148.0) 135.0 (120.0–148.0) 128.0 (111.8–141.0) 125.0 (105.0–140.0) 134.0 (120.0–148.0) Distribution of other findings — no./total no. (%) C-reactive protein ≥10 mg/liter 481/793 (60.7) 371/658 (56.4) 110/135 (81.5) 41/45 (91.1) 440/748 (58.8) Procalcitonin ≥0.5 ng/ml 35/633 (5.5) 19/516 (3.7) 16/117 (13.7) 12/50 (24.0) 23/583 (3.9) Lactate dehydrogenase ≥250 U/liter 277/675 (41.0) 205/551 (37.2) 72/124 (58.1) 31/44 (70.5) 246/631 (39.0) Aspartate aminotransferase >40 U/liter 168/757 (22.2) 112/615 (18.2) 56/142 (39.4) 26/52 (50.0) 142/705 (20.1) Alanine aminotransferase >40 U/liter 158/741 (21.3) 120/606 (19.8) 38/135 (28.1) 20/49 (40.8) 138/692 (19.9) Total bilirubin >17.1 μmol/liter 76/722 (10.5) 59/594 (9.9) 17/128 (13.3) 10/48 (20.8) 66/674 (9.8) Creatine kinase ≥200 U/liter 90/657 (13.7) 67/536 (12.5) 23/121 (19.0) 12/46 (26.1) 78/611 (12.8) Creatinine ≥133 μmol/liter 12/752 (1.6) 6/614 (1.0) 6/138 (4.3) 5/52 (9.6) 7/700 (1.0) d-dimer ≥0.5 mg/liter 260/560 (46.4) 195/451 (43.2) 65/109 (59.6) 34/49 (69.4) 226/511 (44.2) Minerals§ Median sodium (IQR) — mmol/liter 138.2 (136.1–140.3) 138.4 (136.6–140.4) 138.0 (136.0–140.0) 138.3 (135.0–141.2) 138.2 (136.1–140.2) Median potassium (IQR) — mmol/liter 3.8 (3.5–4.2) 3.9 (3.6–4.2) 3.8 (3.5–4.1) 3.9 (3.6–4.1) 3.8 (3.5–4.2) Median chloride (IQR) — mmol/liter 102.9 (99.7–105.6) 102.7 (99.7–105.3) 103.1 (99.8–106.0) 103.8 (100.8–107.0) 102.8 (99.6–105.3) * Lymphocytopenia was defined as a lymphocyte count of less than 1500 per cubic millimeter. Thrombocytopenia was defined as a platelet count of less than 150,000 per cubic millimeter. To convert the values for creatinine to milligrams per deciliter, divide by 88.4. † Data regarding the ratio of the partial pressure of arterial oxygen to the fraction of inspired oxygen (Pao2:Fio2) were missing for 894 patients (81.3%). ‡ Data regarding hemoglobin were missing for 226 patients (20.6%). § Data were missing for the measurement of sodium in 363 patients (33.0%), for potassium in 349 patients (31.8%), and for chloride in 392 patients (35.7%). The New England Journal of Medicine Downloaded from nejm.org at SOUTHERN MEDICAL UNIVERSITY on March 6, 2020. For personal use only. No other uses without permission. Copyright © 2020 Massachusetts Medical Society. All rights reserved