正在加载图片...

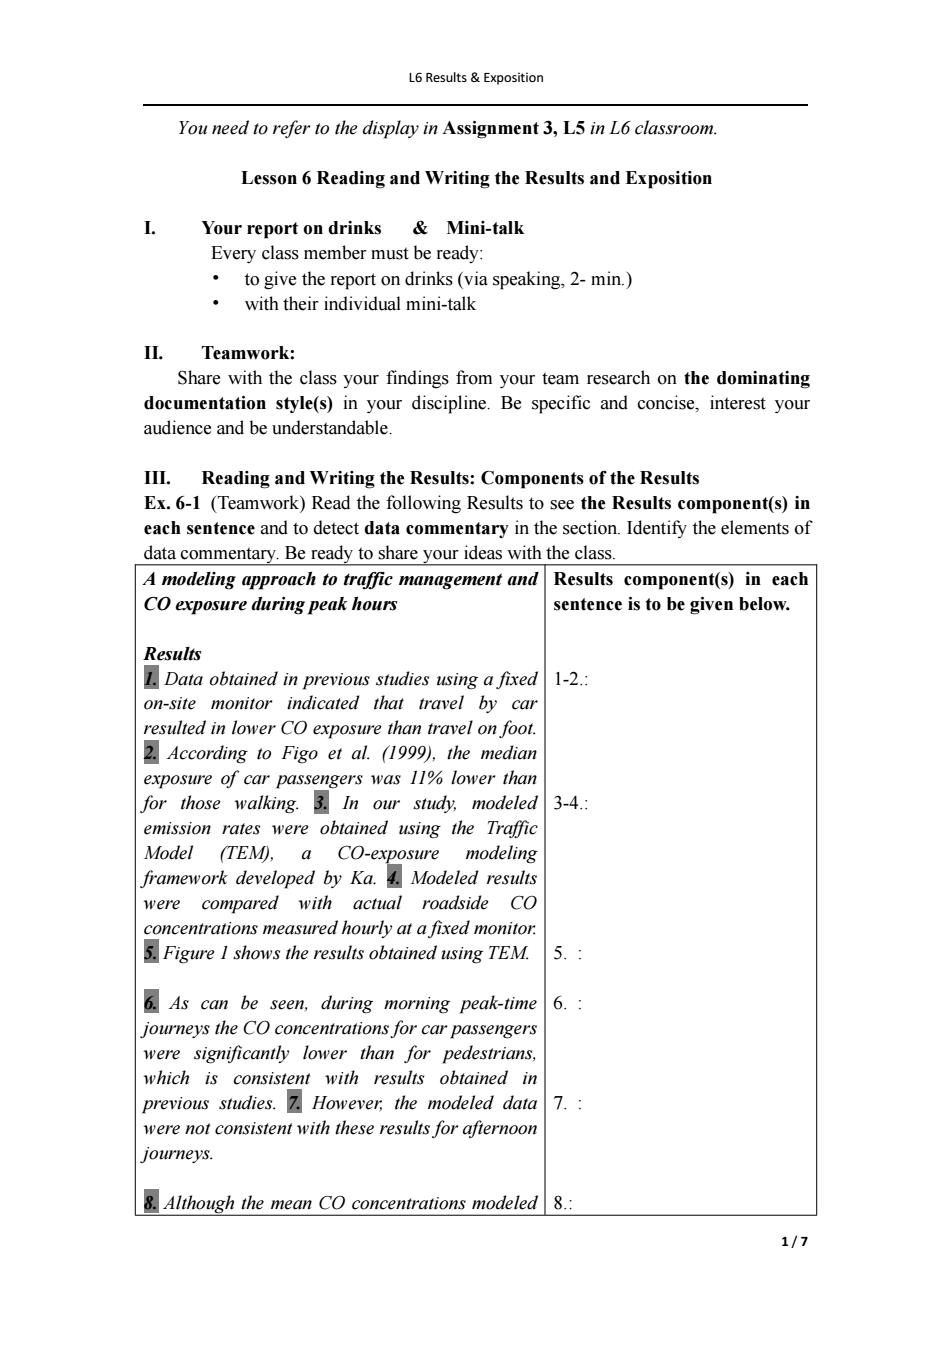
L6 Results Exposition You need to refer to the display in Assignment 3,L5 in L6 classroom. Lesson 6 Reading and Writing the Results and Exposition t Your report on drinks Mini-talk Every class member must be ready: to give the report on drinks (via speaking,2-min.) with their individual mini-talk II.Teamwork: Share with the class your findings from your team research on the dominating documentation style(s)in your discipline.Be specific and concise,interest your audience and be understandable. III.Reading and Writing the Results:Components of the Results Ex.6-1 (Teamwork)Read the following Results to see the Results component(s)in each sentence and to detect data commentary in the section.Identify the elements of data commentary.Be ready to share your ideas with the class. A modeling approach to traffic management and Results component(s)in each CO exposure during peak hours sentence is to be given below. Results 1.Data obtained in previous studies using a fixed 1-2.: on-site monitor indicated that travel by car resulted in lower CO exposure than travel on foot. 2.According to Figo et al.(1999),the median exposure of car passengers was 11%lower than for those walking.3.In our study,modeled 3-4: emission rates were obtained using the Traffic Model (TEM),a CO-exposure modeling framework developed by Ka.4.Modeled results were compared with actual roadside Co concentrations measured hourly at a fixed monitor. 5.Figure I shows the results obtained using TEM. 5.: 6.As can be seen,during morning peak-time 6.: journeys the CO concentrations for car passengers were significantly lower than for pedestrians, which is consistent with results obtained in previous studies.7.However the modeled data 7. were not consistent with these results for afternoon journeys 8.Although the mean CO concentrations modeled8. 1/7L6 Results & Exposition 1 / 7 You need to refer to the display in Assignment 3, L5 in L6 classroom. Lesson 6 Reading and Writing the Results and Exposition I. Your report on drinks & Mini-talk Every class member must be ready: • to give the report on drinks (via speaking, 2- min.) • with their individual mini-talk II. Teamwork: Share with the class your findings from your team research on the dominating documentation style(s) in your discipline. Be specific and concise, interest your audience and be understandable. III. Reading and Writing the Results: Components of the Results Ex. 6-1 (Teamwork) Read the following Results to see the Results component(s) in each sentence and to detect data commentary in the section. Identify the elements of data commentary. Be ready to share your ideas with the class. A modeling approach to traf ic management and CO exposure during peak hours Results 1. Data obtained in previous studies using a fixed on-site monitor indicated that travel by car resulted in lower CO exposure than travel on foot. 2. According to Figo et al. (1999), the median exposure of car passengers was 11% lower than for those walking. 3. In our study, modeled emission rates were obtained using the Traf ic Model (TEM), a CO-exposure modeling framework developed by Ka. 4. Modeled results were compared with actual roadside CO concentrations measured hourly at a fixed monitor. 5. Figure 1 shows the results obtained using TEM. 6. As can be seen, during morning peak-time journeys the CO concentrations for car passengers were significantly lower than for pedestrians, which is consistent with results obtained in previous studies. 7. However, the modeled data were not consistent with these results for afternoon journeys. 8. Although the mean CO concentrations modeled Results component(s) in each sentence is to be given below. 1-2.: 3-4.: 5. : 6. : 7. : 8.: