正在加载图片...
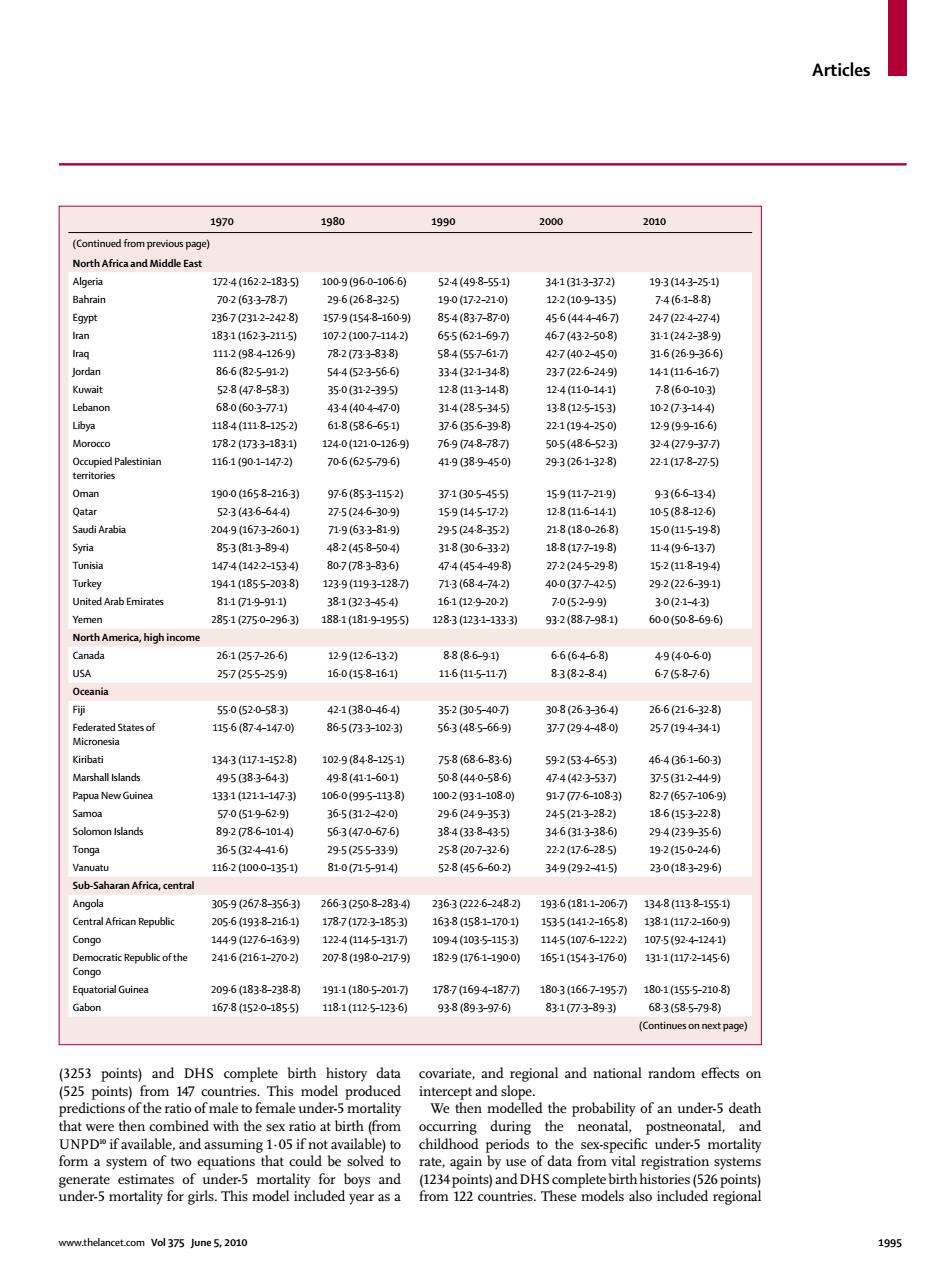
Articles 1970 1980 1990 2000 2010 (Continued from previous page) North Africa and Middle East Algeria 1724(162-2-1835) 1009(960-106.6) 524(49-8-55-1) 34-1(31-3-37-2) 19-3(14-3-25-1) Bahrain 70-2(633-78-7) 29-6(26-8-32-5) 19-0(17-2-21-0) 12-2(10-9-135) 7-4(6-1-8-8) Egypt 2367(2312-242-8) 157-9(154-8-160-9) 854(83-7-87-0) 456(444-46-7) 247(22-4-27-4) Iran 1831(162-3-211-5) 107-2(100-7-114-2) 65-5(621-69-7刀 46-7(43-2-50-8) 31-1(24-2-38-9) Iraq 111-2(98-4-126-9) 78-2(73-3-83-8) 58.4(55-7-61-7刀 42-7(40-2-450) 31-6(26.9-36-6) Jordan 86.6(82-5-91-2) 54-4(523-56-6) 334(32-1-34-8) 23-7(22-6-24-9) 14-1(11-6-167) Kuwait 52-8(47-8-583) 35-0(31-2-395) 128(113-14-8) 124(11-0-14-1) 7-8(6-0-10-3) Lebanon 68.0(60-3-771) 43-4(40-4-47-0) 314(28-5-34-5) 13-8(12-5-153) 102(7-3-144) Libya 1184(111-8-1252) 61-8(58-6-65-1) 37-6356-398) 22-1(194-25-0) 129(9916-6) Morocco 178.2(173-3-1831) 124-0(121-0-126-9) 76-974-8-787) 50-5(48-6-52-3) 32-4(27-9-37-7) Occupied Palestinian 116-1(90-1-147-2) 70-6(62-5-79-6) 41-9(38-945-0) 293(26-1-32-8) 221(17-8-27-5) territories Oman 190-0(165-8-2163 97-6(85-3-115-2) 37-130-5-455) 159(117-219) 93(6.6-134) Qatar 523(43-6-644) 27-5(24-6-30-9) 159(14-5-17-2) 12-8(116-141) 10-5(88-12-6) Saudi Arabia 204-9(1673-260-1) 71-9(633-819) 29-5(24-8-35-2) 21-8(18.0-26-8) 15-0(11-5-19-8) Syria 853(813-894) 48-2(45-8-50-4) 31-8(30-6-332) 188(17-7-19-8) 11-4(9-6-13-7刀 Tunisia 147-4(142-2-153-4) 80-7(78-3-83-6) 47-4(45-4-49-8) 27-.2(245-29-8) 15-2(118-194) Turkey 194-1(185-5-203-8) 123-9(119-3-128-7) 713(68-4-74-2) 40-0(377-42-5) 29-2(22-6-391) United Arab Emirates 81171-991-1) 38-1(32-3-454) 16-1(12-9-202) 7-0(5-2-99) 3-0(21-43) Yemen 285-1(275-0-296.3) 188-1(181-9-195-5) 128.3(123-1-1333) 93-2(88-7-98-1) 60-0(508-69-6) North America,high income Canada 26-1(257-26-6) 12-9(12-6-13-2) 8-8(8.6-9-1) 6-6(6.4-68) 4-9(4-0-6.0) USA 257(255-259) 16-0(158-16-1) 11-6(11-5-11-7) 8-3(8-2-8-4) 6758-76) Oceania F球 55-0(52-0-58-3) 42-1(38-0-46-4) 35-2(30-5-407) 30-8(26-3-364) 26-6(21-6-32-8) Federated States of 115-6(87-4-147-0 86-5(73-3-102-3) 563(48-5-66-9) 37-7(294-48-0) 25-7(194-34-1) Micronesia Kiribati 1343(117-1-152-8) 102-9(84-8-1251) 758(686-83-6) 592(534-653) 46-4(36-1-60-3) Marshall Islands 49538.3-64-3) 49-8(41-1-60-1) 50-8(44-0-58-6) 47-4(423-5370 37-5(31-2-449) Papua New Guinea 133-1(121-1-147-3引 106-0(995-113-8) 100-2(931-108-0) 91-7(77-6-1083) 82-7(65-7-106.9) Samoa 57-0(51-9-62.9) 36-5(312-42-0) 29-6(24-9353) 24-5(21.3-28-2) 18-6(153-22-8) Solomon Islands 892(78-6-101-4) 56-3(47-0-67-6) 384(33-8-43-5) 34-6(31-3-38.6) 294(23-9-35-6) Tonga 365(32-4-41.6) 29-5(25-5-33-9) 25-8(20-7-32-6) 22-2(17-6-285) 19-2(15-0-246) Vanuatu 116.2(100-0-135-1) 81-0(71-5-914) 52-8(45-6-60-2) 349(29-2-41-5) 23-0(18-3-29-6) Sub-Saharan Africa,central Angola 305-9(267-8-356-3) 266-3(2508-283-4 236-3(222-6-2482) 193-6(1811-206-7) 134-8(1138-155-1) Central African Republic 205-6(193-8-216.1) 178-7(172-3-1853) 163-8(158-1-1701) 153-5(141-2-165-8) 138-1(117-2-160-9) Congo 144-9127-6-1639) 122-4(1145-131-7刃 1094(1035-1153) 1145(107-6-122.2) 107-5(92-4-1241) Democratic Republic of the 241-6(2161-270-2) 207-8(198-0-217-9) 182-9(176-1-190.0) 165-1(1543-176-0) 131-1(117-2-145-6 Congo Equatorial Guinea 209-6(183-8-2388) 191-1(180-5-201-7) 178-7(1694-1877) 180-3(166-7-195-7) 1801(155-5-210.8) Gabon 1678(152-0-185-5 118-1(112-5123-6) 93-8(893-97-6) 83-1(773-89-3引 68-3(58-5-79-8) (Continues on next page) (3253 points)and DHS complete birth history data covariate,and regional and national random effects on (525 points)from 147 countries.This model produced intercept and slope. predictions of the ratio of male to female under-5 mortality We then modelled the probability of an under-5 death that were then combined with the sex ratio at birth (from occurring during the neonatal,postneonatal,and UNPD"if available,and assuming 1.05 if not available)to childhood periods to the sex-specific under-5 mortality form a system of two equations that could be solved to rate,again by use of data from vital registration systems generate estimates of under-5 mortality for boys and (1234points)and DHS complete birth histories(526 points) under-5 mortality for girls.This model included year as a from 122 countries.These models also included regional www.thelancet.com Vol 375 June 5,2010 1995Articles www.thelancet.com Vol 375 June 5, 2010 1995 (3253 points) and DHS complete birth history data (525 points) from 147 countries. This model produced predictions of the ratio of male to female under-5 mortality that were then combined with the sex ratio at birth (from UNPD10 if available, and assuming 1·05 if not available) to form a system of two equations that could be solved to generate estimates of under-5 mortality for boys and under-5 mortality for girls. This model included year as a covariate, and regional and national random eff ects on intercept and slope. We then modelled the probability of an under-5 death occurring during the neonatal, postneonatal, and childhood periods to the sex-specifi c under-5 mortality rate, again by use of data from vital registration systems (1234 points) and DHS complete birth histories (526 points) from 122 countries. These models also included regional 1970 1980 1990 2000 2010 (Continued from previous page) North Africa and Middle East Algeria 172·4 (162·2–183·5) 100·9 (96·0–106·6) 52·4 (49·8–55·1) 34·1 (31·3–37·2) 19·3 (14·3–25·1) Bahrain 70·2 (63·3–78·7) 29·6 (26·8–32·5) 19·0 (17·2–21·0) 12·2 (10·9–13·5) 7·4 (6·1–8·8) Egypt 236·7 (231·2–242·8) 157·9 (154·8–160·9) 85·4 (83·7–87·0) 45·6 (44·4–46·7) 24·7 (22·4–27·4) Iran 183·1 (162·3–211·5) 107·2 (100·7–114·2) 65·5 (62·1–69·7) 46·7 (43·2–50·8) 31·1 (24·2–38·9) Iraq 111·2 (98·4–126·9) 78·2 (73·3–83·8) 58·4 (55·7–61·7) 42·7 (40·2–45·0) 31·6 (26·9–36·6) Jordan 86·6 (82·5–91·2) 54·4 (52·3–56·6) 33·4 (32·1–34·8) 23·7 (22·6–24·9) 14·1 (11·6–16·7) Kuwait 52·8 (47·8–58·3) 35·0 (31·2–39·5) 12·8 (11·3–14·8) 12·4 (11·0–14·1) 7·8 (6·0–10·3) Lebanon 68·0 (60·3–77·1) 43·4 (40·4–47·0) 31·4 (28·5–34·5) 13·8 (12·5–15·3) 10·2 (7·3–14·4) Libya 118·4 (111·8–125·2) 61·8 (58·6–65·1) 37·6 (35·6–39·8) 22·1 (19·4–25·0) 12·9 (9·9–16·6) Morocco 178·2 (173·3–183·1) 124·0 (121·0–126·9) 76·9 (74·8–78·7) 50·5 (48·6–52·3) 32·4 (27·9–37·7) Occupied Palestinian territories 116·1 (90·1–147·2) 70·6 (62·5–79·6) 41·9 (38·9–45·0) 29·3 (26·1–32·8) 22·1 (17·8–27·5) Oman 190·0 (165·8–216·3) 97·6 (85·3–115·2) 37·1 (30·5–45·5) 15·9 (11·7–21·9) 9·3 (6·6–13·4) Qatar 52·3 (43·6–64·4) 27·5 (24·6–30·9) 15·9 (14·5–17·2) 12·8 (11·6–14·1) 10·5 (8·8–12·6) Saudi Arabia 204·9 (167·3–260·1) 71·9 (63·3–81·9) 29·5 (24·8–35·2) 21·8 (18·0–26·8) 15·0 (11·5–19·8) Syria 85·3 (81·3–89·4) 48·2 (45·8–50·4) 31·8 (30·6–33·2) 18·8 (17·7–19·8) 11·4 (9·6–13·7) Tunisia 147·4 (142·2–153·4) 80·7 (78·3–83·6) 47·4 (45·4–49·8) 27·2 (24·5–29·8) 15·2 (11·8–19·4) Turkey 194·1 (185·5–203·8) 123·9 (119·3–128·7) 71·3 (68·4–74·2) 40·0 (37·7–42·5) 29·2 (22·6–39·1) United Arab Emirates 81·1 (71·9–91·1) 38·1 (32·3–45·4) 16·1 (12·9–20·2) 7·0 (5·2–9·9) 3·0 (2·1–4·3) Yemen 285·1 (275·0–296·3) 188·1 (181·9–195·5) 128·3 (123·1–133·3) 93·2 (88·7–98·1) 60·0 (50·8–69·6) North America, high income Canada 26·1 (25·7–26·6) 12·9 (12·6–13·2) 8·8 (8·6–9·1) 6·6 (6·4–6·8) 4·9 (4·0–6·0) USA 25·7 (25·5–25·9) 16·0 (15·8–16·1) 11·6 (11·5–11·7) 8·3 (8·2–8·4) 6·7 (5·8–7·6) Oceania Fiji 55·0 (52·0–58·3) 42·1 (38·0–46·4) 35·2 (30·5–40·7) 30·8 (26·3–36·4) 26·6 (21·6–32·8) Federated States of Micronesia 115·6 (87·4–147·0) 86·5 (73·3–102·3) 56·3 (48·5–66·9) 37·7 (29·4–48·0) 25·7 (19·4–34·1) Kiribati 134·3 (117·1–152·8) 102·9 (84·8–125·1) 75·8 (68·6–83·6) 59·2 (53·4–65·3) 46·4 (36·1–60·3) Marshall Islands 49·5 (38·3–64·3) 49·8 (41·1–60·1) 50·8 (44·0–58·6) 47·4 (42·3–53·7) 37·5 (31·2–44·9) Papua New Guinea 133·1 (121·1–147·3) 106·0 (99·5–113·8) 100·2 (93·1–108·0) 91·7 (77·6–108·3) 82·7 (65·7–106·9) Samoa 57·0 (51·9–62·9) 36·5 (31·2–42·0) 29·6 (24·9–35·3) 24·5 (21·3–28·2) 18·6 (15·3–22·8) Solomon Islands 89·2 (78·6–101·4) 56·3 (47·0–67·6) 38·4 (33·8–43·5) 34·6 (31·3–38·6) 29·4 (23·9–35·6) Tonga 36·5 (32·4–41·6) 29·5 (25·5–33·9) 25·8 (20·7–32·6) 22·2 (17·6–28·5) 19·2 (15·0–24·6) Vanuatu 116·2 (100·0–135·1) 81·0 (71·5–91·4) 52·8 (45·6–60·2) 34·9 (29·2–41·5) 23·0 (18·3–29·6) Sub-Saharan Africa, central Angola 305·9 (267·8–356·3) 266·3 (250·8–283·4) 236·3 (222·6–248·2) 193·6 (181·1–206·7) 134·8 (113·8–155·1) Central African Republic 205·6 (193·8–216·1) 178·7 (172·3–185·3) 163·8 (158·1–170·1) 153·5 (141·2–165·8) 138·1 (117·2–160·9) Congo 144·9 (127·6–163·9) 122·4 (114·5–131·7) 109·4 (103·5–115·3) 114·5 (107·6–122·2) 107·5 (92·4–124·1) Democratic Republic of the Congo 241·6 (216·1–270·2) 207·8 (198·0–217·9) 182·9 (176·1–190·0) 165·1 (154·3–176·0) 131·1 (117·2–145·6) Equatorial Guinea 209·6 (183·8–238·8) 191·1 (180·5–201·7) 178·7 (169·4–187·7) 180·3 (166·7–195·7) 180·1 (155·5–210·8) Gabon 167·8 (152·0–185·5) 118·1 (112·5–123·6) 93·8 (89·3–97·6) 83·1 (77·3–89·3) 68·3 (58·5–79·8) (Continues on next page)