正在加载图片...
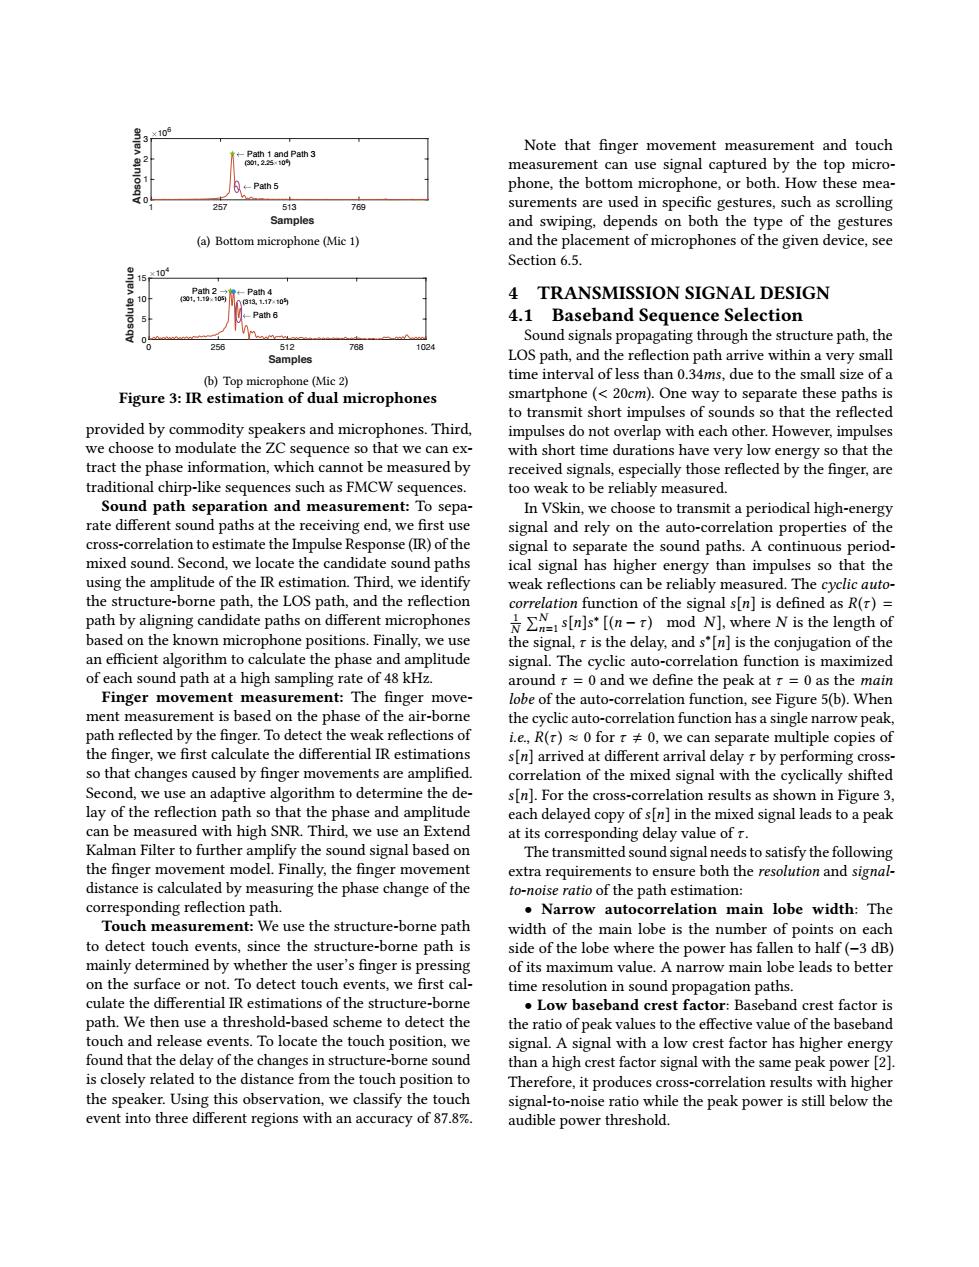
roah3 Note that finger movement measurement and touch measurement can use signal captured by the top micro- &←Pahs phone,the bottom microphone,or both.How these mea- 257 513 769 surements are used in specific gestures,such as scrolling Samples and swiping,depends on both the type of the gestures (a)Bottom microphone (Mic 1) and the placement of microphones of the given device,see Section 6.5. -Path 4 3131.17105 4 TRANSMISSION SIGNAL DESIGN -Path 6 4.1 Baseband Sequence Selection Sound signals propagating through the structure path,the 512 76 Samples LOS path,and the reflection path arrive within a very small (b)Top microphone(Mic 2) time interval of less than 0.34ms,due to the small size of a Figure 3:IR estimation of dual microphones smartphone (20cm).One way to separate these paths is to transmit short impulses of sounds so that the reflected provided by commodity speakers and microphones.Third, impulses do not overlap with each other.However,impulses we choose to modulate the ZC sequence so that we can ex- with short time durations have very low energy so that the tract the phase information,which cannot be measured by received signals,especially those reflected by the finger,are traditional chirp-like sequences such as FMCW sequences. too weak to be reliably measured. Sound path separation and measurement:To sepa- In VSkin,we choose to transmit a periodical high-energy rate different sound paths at the receiving end,we first use signal and rely on the auto-correlation properties of the cross-correlation to estimate the Impulse Response (IR)of the signal to separate the sound paths.A continuous period- mixed sound.Second,we locate the candidate sound paths ical signal has higher energy than impulses so that the using the amplitude of the IR estimation.Third,we identify weak reflections can be reliably measured.The cyclic auto- the structure-borne path,the LOS path,and the reflection correlation function of the signal s[n]is defined as R(r)= path by aligning candidate paths on different microphones 为∑N!s[ns*[n-r)modN],where N is the length of based on the known microphone positions.Finally,we use the signal,r is the delay,and s'[n]is the conjugation of the an efficient algorithm to calculate the phase and amplitude signal.The cyclic auto-correlation function is maximized of each sound path at a high sampling rate of 48 kHz. around r =0 and we define the peak at r =0 as the main Finger movement measurement:The finger move- lobe of the auto-correlation function,see Figure 5(b).When ment measurement is based on the phase of the air-borne the cyclic auto-correlation function has a single narrow peak, path reflected by the finger.To detect the weak reflections of i.e.,R(r)0 for r +0,we can separate multiple copies of the finger,we first calculate the differential IR estimations s[n]arrived at different arrival delay r by performing cross- so that changes caused by finger movements are amplified. correlation of the mixed signal with the cyclically shifted Second,we use an adaptive algorithm to determine the de- s[n].For the cross-correlation results as shown in Figure 3, lay of the reflection path so that the phase and amplitude each delayed copy of s[n]in the mixed signal leads to a peak can be measured with high SNR.Third,we use an Extend at its corresponding delay value of r. Kalman Filter to further amplify the sound signal based on The transmitted sound signal needs to satisfy the following the finger movement model.Finally,the finger movement extra requirements to ensure both the resolution and signal- distance is calculated by measuring the phase change of the to-noise ratio of the path estimation: corresponding reflection path. Narrow autocorrelation main lobe width:The Touch measurement:We use the structure-borne path width of the main lobe is the number of points on each to detect touch events,since the structure-borne path is side of the lobe where the power has fallen to half(-3 dB) mainly determined by whether the user's finger is pressing of its maximum value.A narrow main lobe leads to better on the surface or not.To detect touch events,we first cal- time resolution in sound propagation paths. culate the differential IR estimations of the structure-borne Low baseband crest factor:Baseband crest factor is path.We then use a threshold-based scheme to detect the the ratio of peak values to the effective value of the baseband touch and release events.To locate the touch position,we signal.A signal with a low crest factor has higher energy found that the delay of the changes in structure-borne sound than a high crest factor signal with the same peak power [2] is closely related to the distance from the touch position to Therefore,it produces cross-correlation results with higher the speaker.Using this observation,we classify the touch signal-to-noise ratio while the peak power is still below the event into three different regions with an accuracy of 87.8%. audible power threshold.1 257 513 769 Samples 0 1 2 3 Absolute value 106 (301, 2.25 106) Path 1 and Path 3 Path 5 (a) Bottom microphone (Mic 1) 0 256 512 768 1024 Samples 0 5 10 15 Absolute value 104 Path 2 (301, 1.19 105) Path 4 (313, 1.17 105) Path 6 (b) Top microphone (Mic 2) Figure 3: IR estimation of dual microphones provided by commodity speakers and microphones. Third, we choose to modulate the ZC sequence so that we can extract the phase information, which cannot be measured by traditional chirp-like sequences such as FMCW sequences. Sound path separation and measurement: To separate different sound paths at the receiving end, we first use cross-correlation to estimate the Impulse Response (IR) of the mixed sound. Second, we locate the candidate sound paths using the amplitude of the IR estimation. Third, we identify the structure-borne path, the LOS path, and the reflection path by aligning candidate paths on different microphones based on the known microphone positions. Finally, we use an efficient algorithm to calculate the phase and amplitude of each sound path at a high sampling rate of 48 kHz. Finger movement measurement: The finger movement measurement is based on the phase of the air-borne path reflected by the finger. To detect the weak reflections of the finger, we first calculate the differential IR estimations so that changes caused by finger movements are amplified. Second, we use an adaptive algorithm to determine the delay of the reflection path so that the phase and amplitude can be measured with high SNR. Third, we use an Extend Kalman Filter to further amplify the sound signal based on the finger movement model. Finally, the finger movement distance is calculated by measuring the phase change of the corresponding reflection path. Touch measurement: We use the structure-borne path to detect touch events, since the structure-borne path is mainly determined by whether the user’s finger is pressing on the surface or not. To detect touch events, we first calculate the differential IR estimations of the structure-borne path. We then use a threshold-based scheme to detect the touch and release events. To locate the touch position, we found that the delay of the changes in structure-borne sound is closely related to the distance from the touch position to the speaker. Using this observation, we classify the touch event into three different regions with an accuracy of 87.8%. Note that finger movement measurement and touch measurement can use signal captured by the top microphone, the bottom microphone, or both. How these measurements are used in specific gestures, such as scrolling and swiping, depends on both the type of the gestures and the placement of microphones of the given device, see Section 6.5. 4 TRANSMISSION SIGNAL DESIGN 4.1 Baseband Sequence Selection Sound signals propagating through the structure path, the LOS path, and the reflection path arrive within a very small time interval of less than 0.34ms, due to the small size of a smartphone (< 20cm). One way to separate these paths is to transmit short impulses of sounds so that the reflected impulses do not overlap with each other. However, impulses with short time durations have very low energy so that the received signals, especially those reflected by the finger, are too weak to be reliably measured. In VSkin, we choose to transmit a periodical high-energy signal and rely on the auto-correlation properties of the signal to separate the sound paths. A continuous periodical signal has higher energy than impulses so that the weak reflections can be reliably measured. The cyclic autocorrelation function of the signal s[n] is defined as R(τ ) = 1 N PN n=1 s[n]s ∗ [(n − τ ) mod N], where N is the length of the signal, τ is the delay, and s ∗ [n] is the conjugation of the signal. The cyclic auto-correlation function is maximized around τ = 0 and we define the peak at τ = 0 as the main lobe of the auto-correlation function, see Figure 5(b). When the cyclic auto-correlation function has a single narrow peak, i.e., R(τ ) ≈ 0 for τ , 0, we can separate multiple copies of s[n] arrived at different arrival delay τ by performing crosscorrelation of the mixed signal with the cyclically shifted s[n]. For the cross-correlation results as shown in Figure 3, each delayed copy of s[n] in the mixed signal leads to a peak at its corresponding delay value of τ . The transmitted sound signal needs to satisfy the following extra requirements to ensure both the resolution and signalto-noise ratio of the path estimation: • Narrow autocorrelation main lobe width: The width of the main lobe is the number of points on each side of the lobe where the power has fallen to half (−3 dB) of its maximum value. A narrow main lobe leads to better time resolution in sound propagation paths. • Low baseband crest factor: Baseband crest factor is the ratio of peak values to the effective value of the baseband signal. A signal with a low crest factor has higher energy than a high crest factor signal with the same peak power [2]. Therefore, it produces cross-correlation results with higher signal-to-noise ratio while the peak power is still below the audible power threshold