正在加载图片...
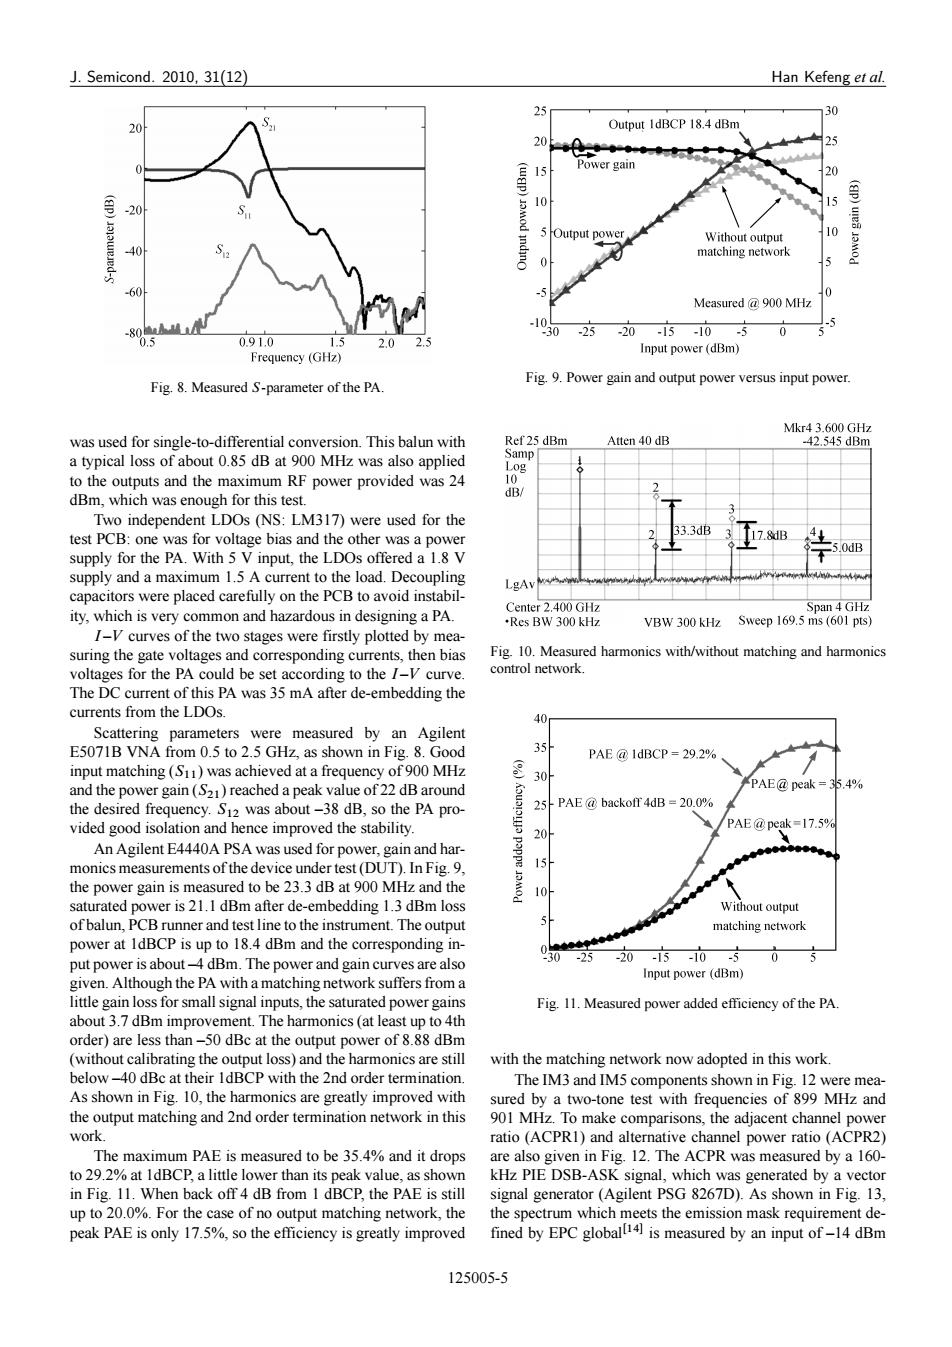
J.Semicond.2010,31(12) Han Kefeng et al. 25 30 Output 1dBCP 18.4 dBm 200 25 15 Power gain (ap) -20 0 power Without output 10 40 matching network 5 -60 Measured 900 MHz -80 -30 25 -20-15-10-5 0 0.5 0.91.0 5 Frequency(GHz) Input power (dBm) Fig.9.Power gain and output power versus input power. Fig.8.Measured S-parameter of the PA Mkr4 3.600 GHz was used for single-to-differential conversion.This balun with Ref 25 dBm Atten 40 dB 42.545dBm a typical loss of about 0.85 dB at 900 MHz was also applied Samp 10g to the outputs and the maximum RF power provided was 24 10 dB/ dBm,which was enough for this test. Two independent LDOs(NS:LM317)were used for the 3.3dB test PCB:one was for voltage bias and the other was a power 1Z.8&B .0dB supply for the PA.With 5 V input,the LDOs offered a 1.8 V supply and a maximum 1.5 A current to the load.Decoupling LgAv capacitors were placed carefully on the PCB to avoid instabil- Center 2,400 GHz Span 4 GHz ity,which is very common and hazardous in designing a PA. ·Res BW300kHz VBW 300 kHz Sweep 169.5 ms (601 pts) I-V curves of the two stages were firstly plotted by mea- suring the gate voltages and corresponding currents,then bias Fig.10.Measured harmonics with/without matching and harmonics voltages for the PA could be set according to the I-V curve. control network. The DC current of this PA was 35 mA after de-embedding the currents from the LDOs. 40 Scattering parameters were measured by an Agilent E5071B VNA from 0.5 to 2.5 GHz,as shown in Fig.8.Good 35H PAE 1dBCP=29.2% input matching(S1)was achieved at a frequency of 900 MHz and the power gain(S21)reached a peak value of 22 dB around PAE@peak =35.4% the desired frequency.S12 was about-38 dB,so the PA pro- 25-PAE backoff 4dB=20.0% vided good isolation and hence improved the stability. PAE@peak=17.5% 20 An Agilent E4440A PSA was used for power,gain and har- monics measurements of the device under test(DUT).In Fig.9. 15 the power gain is measured to be 23.3 dB at 900 MHz and the 10 saturated power is 21.1 dBm after de-embedding 1.3 dBm loss Without output of balun,PCB runner and test line to the instrument.The output matching network power at 1dBCP is up to 18.4 dBm and the corresponding in- 25 put power is about-4 dBm.The power and gain curves are also -20-15-10-505 given.Although the PA with a matching network suffers from a Input power (dBm) little gain loss for small signal inputs,the saturated power gains Fig.11.Measured power added efficiency of the PA about 3.7 dBm improvement.The harmonics(at least up to 4th order)are less than-50 dBc at the output power of 8.88 dBm (without calibrating the output loss)and the harmonics are still with the matching network now adopted in this work. below-40 dBc at their 1dBCP with the 2nd order termination. The IM3 and IM5 components shown in Fig.12 were mea- As shown in Fig.10,the harmonics are greatly improved with sured by a two-tone test with frequencies of 899 MHz and the output matching and 2nd order termination network in this 901 MHz.To make comparisons,the adjacent channel power work. ratio(ACPRI)and alternative channel power ratio (ACPR2) The maximum PAE is measured to be 35.4%and it drops are also given in Fig.12.The ACPR was measured by a 160- to 29.2%at 1dBCP,a little lower than its peak value,as shown kHz PIE DSB-ASK signal,which was generated by a vector in Fig.11.When back off 4 dB from 1 dBCP,the PAE is still signal generator(Agilent PSG 8267D).As shown in Fig.13, up to 20.0%.For the case of no output matching network,the the spectrum which meets the emission mask requirement de- peak PAE is only 17.5%,so the efficiency is greatly improved fined by EPC globall is measured by an input of-14 dBm 125005-5J. Semicond. 2010, 31(12) Han Kefeng et al. Fig. 8. Measured S-parameter of the PA. was used for single-to-differential conversion. This balun with a typical loss of about 0.85 dB at 900 MHz was also applied to the outputs and the maximum RF power provided was 24 dBm, which was enough for this test. Two independent LDOs (NS: LM317) were used for the test PCB: one was for voltage bias and the other was a power supply for the PA. With 5 V input, the LDOs offered a 1.8 V supply and a maximum 1.5 A current to the load. Decoupling capacitors were placed carefully on the PCB to avoid instability, which is very common and hazardous in designing a PA. I –V curves of the two stages were firstly plotted by measuring the gate voltages and corresponding currents, then bias voltages for the PA could be set according to the I –V curve. The DC current of this PA was 35 mA after de-embedding the currents from the LDOs. Scattering parameters were measured by an Agilent E5071B VNA from 0.5 to 2.5 GHz, as shown in Fig. 8. Good input matching (S11) was achieved at a frequency of 900 MHz and the power gain (S21) reached a peak value of 22 dB around the desired frequency. S12 was about –38 dB, so the PA provided good isolation and hence improved the stability. An Agilent E4440A PSA was used for power, gain and harmonics measurements of the device under test (DUT). In Fig. 9, the power gain is measured to be 23.3 dB at 900 MHz and the saturated power is 21.1 dBm after de-embedding 1.3 dBm loss of balun, PCB runner and test line to the instrument. The output power at 1dBCP is up to 18.4 dBm and the corresponding input power is about –4 dBm. The power and gain curves are also given. Although the PA with a matching network suffers from a little gain loss for small signal inputs, the saturated power gains about 3.7 dBm improvement. The harmonics (at least up to 4th order) are less than –50 dBc at the output power of 8.88 dBm (without calibrating the output loss) and the harmonics are still below –40 dBc at their 1dBCP with the 2nd order termination. As shown in Fig. 10, the harmonics are greatly improved with the output matching and 2nd order termination network in this work. The maximum PAE is measured to be 35.4% and it drops to 29.2% at 1dBCP, a little lower than its peak value, as shown in Fig. 11. When back off 4 dB from 1 dBCP, the PAE is still up to 20.0%. For the case of no output matching network, the peak PAE is only 17.5%, so the efficiency is greatly improved Fig. 9. Power gain and output power versus input power. Fig. 10. Measured harmonics with/without matching and harmonics control network. Fig. 11. Measured power added efficiency of the PA. with the matching network now adopted in this work. The IM3 and IM5 components shown in Fig. 12 were measured by a two-tone test with frequencies of 899 MHz and 901 MHz. To make comparisons, the adjacent channel power ratio (ACPR1) and alternative channel power ratio (ACPR2) are also given in Fig. 12. The ACPR was measured by a 160- kHz PIE DSB-ASK signal, which was generated by a vector signal generator (Agilent PSG 8267D). As shown in Fig. 13, the spectrum which meets the emission mask requirement defined by EPC globalŒ14 is measured by an input of –14 dBm 125005-5