正在加载图片...

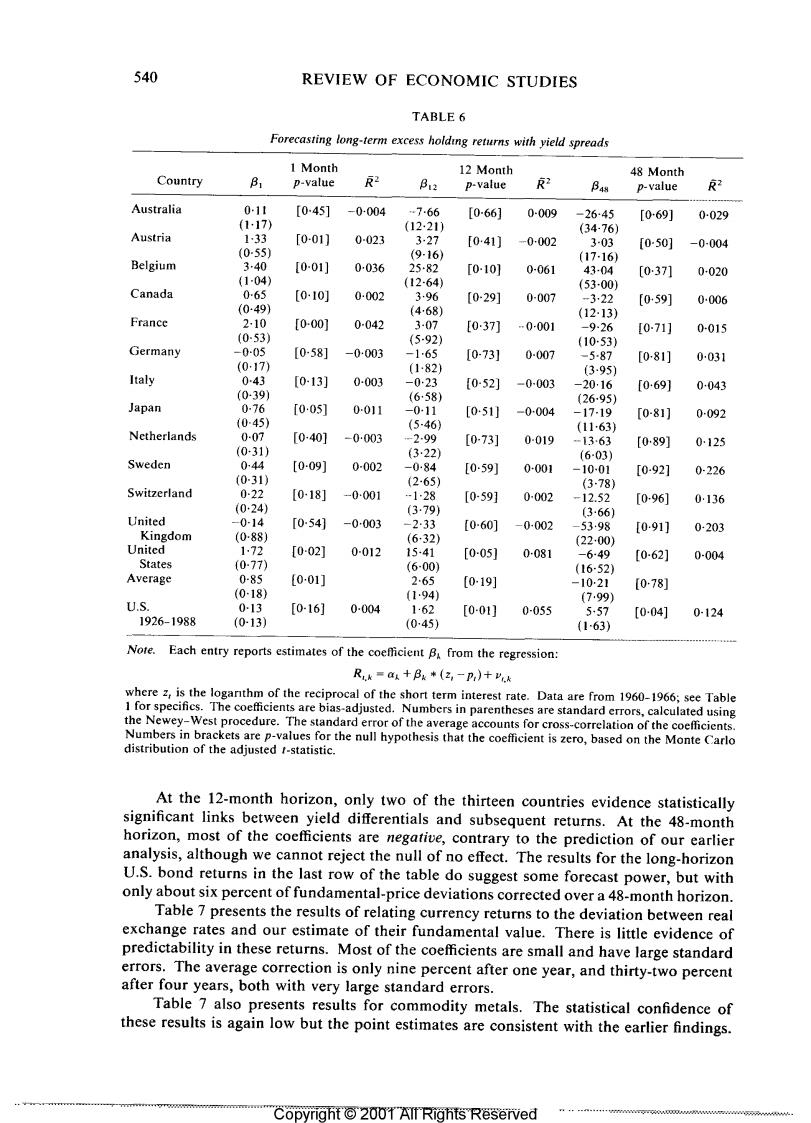
540 REVIEW OF ECONOMIC STUDIES TABLE 6 Forecasting long-term excess holding returns with yield spreads 1 Month 12 Month 48 Month Country B p-value 反2 B12 p-value 2 B4s p-value 反2 Australia 0-11 [045] -0004 …7-66 [0-66] 0-009 -26-45 [069] 0-029 (117) (12-21) (34-76) Austria 133 [0-01] 0-023 3-27 [041) -0002 3-03 [050] -0-004 (0-55) (9-16) (17-16) Belgium 340 I0-01] 0036 25-82 [0-10] 0-061 43-04 [0371 0-020 (1-04) (12-64) (53-00) Canada 0-65 [0-10] 0-002 3.96 [0-29] 0-007 -322 [059] 0-006 (0-49) (468) (12-13) France 2-10 [0-00] 0-042 307 [037] -0-001 -9-26 I0-71] 0-015 (0-53) (5-92) (1053 Germany -0-05 [058] -0-003 -165 [0-731 0-007 -5-87 [081] 0031 (0-17) (182) (395) Italy 043 [0-13] 0-003 -023 [052] -0-003 -2016 [0691 0-043 (039) (658) 2695) Japan 076 [0051 0011 -0-11 [0-51」 -0004 -17-19 [0-81] 0-092 (045) (5-46) (1163) Netherlands 0-07 [0-40] -0003 -299 [073] 0-019 -1363 [089] 0125 (0-31) (3·22) (6-03) Sweden 0-44 [0-09] 0-002 -0-84 [059] 0-001 -10-01 [0-92] 0-226 (0-31) (2-65) (3-78) Switzerland 0-22 [0-18] -0001 -128 [059] 0-002 -12.52 [096] 0136 (024) (3.79) (366) United -0-14 [054] -0003 -2-33 [0-60] -0-002 -5398 [091] 0-203 Kingdom (0-88) (6-32) (2200) United 1.72 [002] 0012 15-41 [0-05] 0-081 -6-49 [062] 0-004 States (0-77) (6-00) (16-52) Average 0-85 [001] 265 [0-19] -1021 [078] (0-18) (194) (799) U.S. 013 [0-16] 0-004 1:62 [0-01] 0-055 5,57 [0041 0-124 1926-1988 (0-13) (045) (163) Note. Each entry reports estimates of the coefficient B from the regression: R,k=a十B*(2,-P,)+k where z,is the loganthm of the reciprocal of the short term interest rate.Data are from 1960-1966;see Table 1 for specifics.The coefficients are bias-adjusted.Numbers in parentheses are standard errors,calculated using the Newey-West procedure.The standard error of the average accounts for cross-correlation of the coefficients. Numbers in brackets are p-values for the null hypothesis that the coefficient is zero,based on the Monte Carlo distribution of the adjusted t-statistic. At the 12-month horizon,only two of the thirteen countries evidence statistically significant links between yield differentials and subsequent returns.At the 48-month horizon,most of the coefficients are negative,contrary to the prediction of our earlier analysis,although we cannot reject the null of no effect.The results for the long-horizon U.S.bond returns in the last row of the table do suggest some forecast power,but with only about six percent of fundamental-price deviations corrected over a 48-month horizon. Table 7 presents the results of relating currency returns to the deviation between real exchange rates and our estimate of their fundamental value.There is little evidence of predictability in these returns.Most of the coefficients are small and have large standard errors.The average correction is only nine percent after one year,and thirty-two percent after four years,both with very large standard errors. Table 7 also presents results for commodity metals.The statistical confidence of these results is again low but the point estimates are consistent with the earlier findings. Copyright o 2001 All Rights Reserved