正在加载图片...

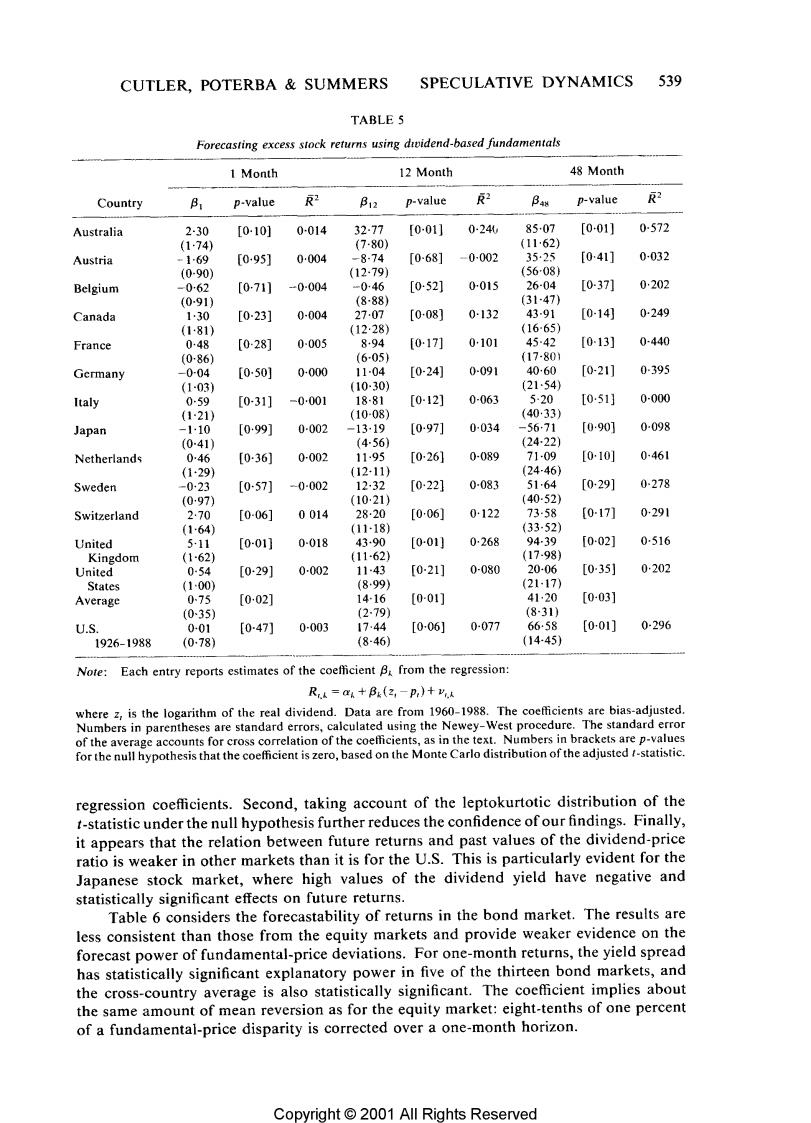
CUTLER,POTERBA SUMMERS SPECULATIVE DYNAMICS 539 TABLE 5 Forecasting excess stock returns using dividend-based fundamentals 1 Month 12 Month 48 Month Country B p-value R2 B12 p-value R2 B48 p-value 反2 Australia 2-30 [0-10] 0014 32.77 [001] 0-240 8507 [0-011 0-572 (1-74) (7-80) (1162) Austria -69 [095] 0-004 -8-74 [068] -0-002 35.25 [041] 0-032 (0-90) (12.79) (5608) Belgium -062 [0711 -0-004 -046 [052] 0-015 26-04 [0-37] 0202 (091) (8-88) (31-47) Canada 130 [0-23] 0004 2707 [0-08] 0-132 4391 [0-14] 0-249 (1-81) (12·28) (1665) France 048 [0-28] 0-005 894 [0-17] 0101 45-42 [013] 0-440 (0-86) (6-05) (17-801 Germany -004 [050] 0-000 11-04 [0-24] 0-091 4060 [0-21] 0-395 (103) (10-30) (2154) Italy 059 [0-31] -0001 18-81 [0-12] 0-063 5-20 [051] 0-000 (121) (1008) (40·33) Japan -110 [099] 0-002 -13-19 [097] 0034 -56:71 [090] 0-098 (0-41) (4-56) (24-22) Netherlands 046 [0-36] 0-002 11.95 [0-26] 0-089 7109 [010] 0-461 (1·29) (12-11) (24-46) Sweden -023 [057] -0-002 12-32 [022] 0-083 5164 [029] 0-278 (097) (10.21) (40-52) Switzerland 270 [0-06] 0014 28·20 [006] 0122 73-58 [017] 0291 (164) (11-18) (33-52) United 5-11 [0-01] 0-018 43-90 [0-01] 0268 9439 [002] 0516 Kingdom (1-62 (11-62) (17-98) United 0-54 [029] 0002 1143 [0-21] 0-080 20-06 [0-35] 0202 States (100) (899) (21-17) Average 0.75 [002] 14-16 [0-01] 41·20 [0-03] (035) (2.79) (8-31) U.S. 001 [0-47] 0-003 1744 [006] 0-077 66-58 [001 0-296 1926-1988 (0-78 (8-46) (14-45) Note:Each entry reports estimates of the coefficient B from the regression: Ri=a+Bx(2-P)+Vk where z,is the logarithm of the real dividend.Data are from 1960-1988.The coefficients are bias-adjusted. Numbers in parentheses are standard errors,calculated using the Newey-West procedure.The standard error of the average accounts for cross correlation of the coefficients,as in the text.Numbers in brackets are p-values for the null hypothesis that the coefficient is zero,based on the Monte Carlo distribution of the adjusted t-statistic. regression coefficients.Second,taking account of the leptokurtotic distribution of the t-statistic under the null hypothesis further reduces the confidence of our findings.Finally, it appears that the relation between future returns and past values of the dividend-price ratio is weaker in other markets than it is for the U.S.This is particularly evident for the Japanese stock market,where high values of the dividend yield have negative and statistically significant effects on future returns. Table 6 considers the forecastability of returns in the bond market.The results are less consistent than those from the equity markets and provide weaker evidence on the forecast power of fundamental-price deviations.For one-month returns,the yield spread has statistically significant explanatory power in five of the thirteen bond markets,and the cross-country average is also statistically significant.The coefficient implies about the same amount of mean reversion as for the equity market:eight-tenths of one percent of a fundamental-price disparity is corrected over a one-month horizon. Copyright 2001 All Rights Reserved