正在加载图片...

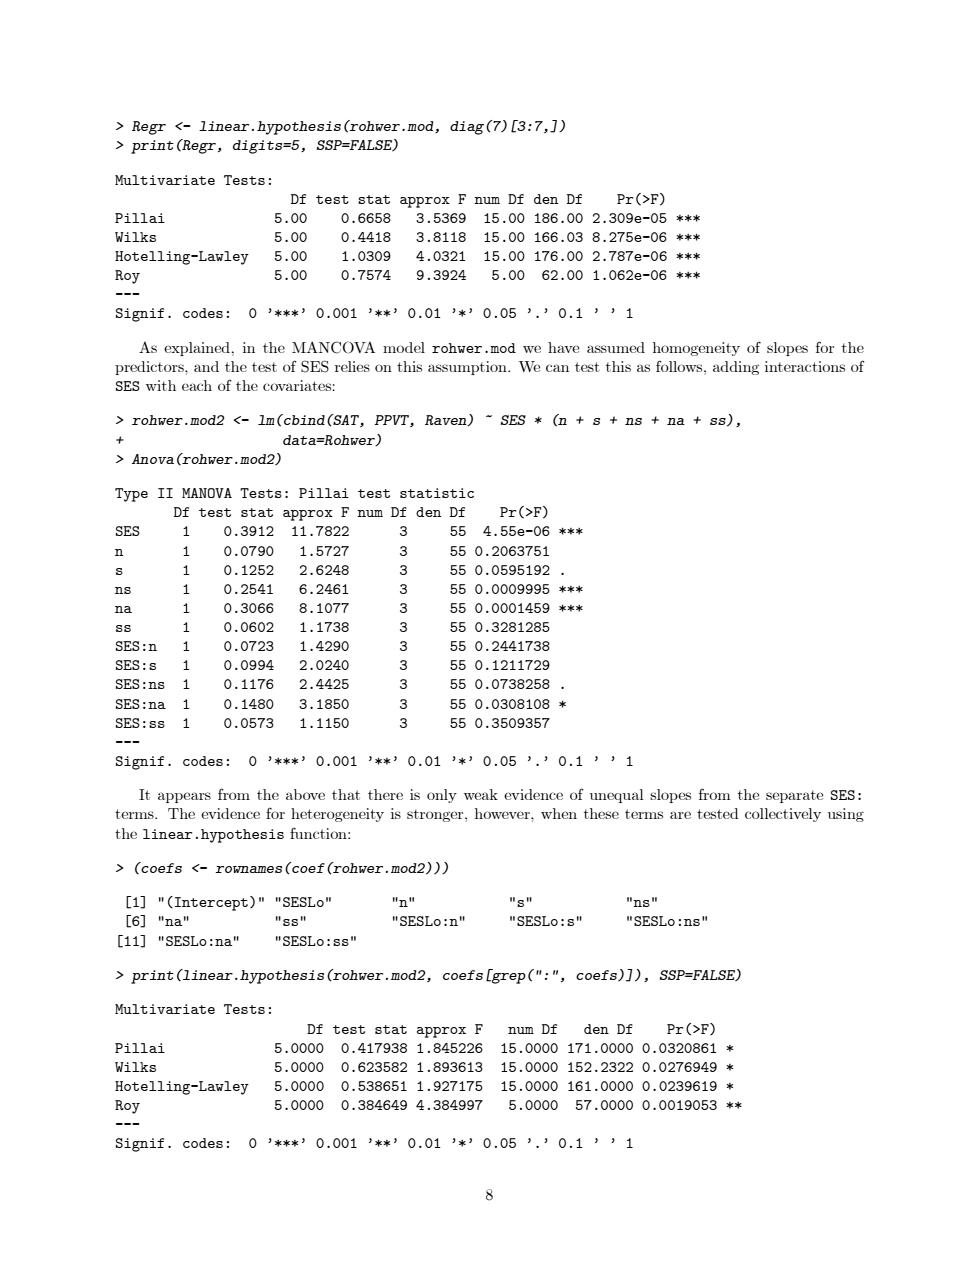
Regr <-linear.hypothesis(rohwer.mod,diag(7)[3:7,] print(Regr,digits=5,SSP=FALSE) Multivariate Tests: Df test stat approx F num Df den Df Pr(>F) Pillai 5.00 0.6658 3.536915.00186.002.309e-05*** Wilks 5.00 0.4418 3.811815.00166.038.275e-06*** Hotelling-Lawley 5.00 1.0309 4.032115.00176.002.787e-06*** Roy 5.00 0.7574 9.39245.0062,001,062e-06*** -- S1gif.codes:0’**’0.001’*’0.01’*’0.05’.’0.1’’1 As explained,in the MANCOVA model rohwer.mod we have assumed homogeneity of slopes for the predictors,and the test of SES relies on this assumption.We can test this as follows,adding interactions of SES with each of the covariates: rohwer.mod2 <-1m(cbind(SAT,PPVT,Raven)-SES (n +s +ns na ss), data=Rohwer) Anova(rohwer.mod2) Type II MANOVA Tests:Pillai test statistic Df test stat approx F num Df den Df Pr(>F) SES 1 0.391211,7822 3 55 4,55e-06**米 n 0.0790 1.5727 550.2063751 8 0.1252 2.6248 3 550.0595192 ns 1 0.2541 6.2461 3 550.0009995*** na 0.3066 8.1077 0 550.0001459*** 88 1 0.0602 1.1738 3 550.3281285 SES:n 1 0.0723 1.4290 550.2441738 SES:s 0.0994 2.0240 3 550.1211729 SES:ns 1 0.1176 2.4425 550.0738258 SES:na 0.1480 3.1850 550.0308108* SES:ss 0.0573 1.1150 550.3509357 S1g即if.codes:0’**’0.001’*’0.01’*)0.05’.’0.1’’1 It appears from the above that there is only weak evidence of unequal slopes from the separate SES: terms.The evidence for heterogeneity is stronger,however,when these terms are tested collectively using the linear.hypothesis function: >(coefs <-rownames(coef(rohwer.mod2))) [1]"(Intercept)""SESLo" "n" "ns" [6]"na" "88" "SESLo:n" "SESLO:S" "SESLo:ns" [11]"SESLo:na" "SESLo:ss" print(linear.hypothesis(rohwer.mod2,coefs [grep(":"coefs)]),SSP=FALSE) Multivariate Tests: Df test stat approx F num Df den Df Pr(>F) Pillai 5.00000.4179381.84522615.0000171.00000.0320861* Wilks 5.00000.6235821.89361315.0000152.23220.0276949* Hotelling-Lawley 5.00000.5386511.927175 15.0000161.00000.0239619* Roy 5.00000.3846494.384997 5.000057.00000.0019053** Signif.codes: 03***30.0013**30.013*)0.053.30.1331 8> Regr <- linear.hypothesis(rohwer.mod, diag(7)[3:7,]) > print(Regr, digits=5, SSP=FALSE) Multivariate Tests: Df test stat approx F num Df den Df Pr(>F) Pillai 5.00 0.6658 3.5369 15.00 186.00 2.309e-05 *** Wilks 5.00 0.4418 3.8118 15.00 166.03 8.275e-06 *** Hotelling-Lawley 5.00 1.0309 4.0321 15.00 176.00 2.787e-06 *** Roy 5.00 0.7574 9.3924 5.00 62.00 1.062e-06 *** --- Signif. codes: 0 ’***’ 0.001 ’**’ 0.01 ’*’ 0.05 ’.’ 0.1 ’ ’ 1 As explained, in the MANCOVA model rohwer.mod we have assumed homogeneity of slopes for the predictors, and the test of SES relies on this assumption. We can test this as follows, adding interactions of SES with each of the covariates: > rohwer.mod2 <- lm(cbind(SAT, PPVT, Raven) ~ SES * (n + s + ns + na + ss), + data=Rohwer) > Anova(rohwer.mod2) Type II MANOVA Tests: Pillai test statistic Df test stat approx F num Df den Df Pr(>F) SES 1 0.3912 11.7822 3 55 4.55e-06 *** n 1 0.0790 1.5727 3 55 0.2063751 s 1 0.1252 2.6248 3 55 0.0595192 . ns 1 0.2541 6.2461 3 55 0.0009995 *** na 1 0.3066 8.1077 3 55 0.0001459 *** ss 1 0.0602 1.1738 3 55 0.3281285 SES:n 1 0.0723 1.4290 3 55 0.2441738 SES:s 1 0.0994 2.0240 3 55 0.1211729 SES:ns 1 0.1176 2.4425 3 55 0.0738258 . SES:na 1 0.1480 3.1850 3 55 0.0308108 * SES:ss 1 0.0573 1.1150 3 55 0.3509357 --- Signif. codes: 0 ’***’ 0.001 ’**’ 0.01 ’*’ 0.05 ’.’ 0.1 ’ ’ 1 It appears from the above that there is only weak evidence of unequal slopes from the separate SES: terms. The evidence for heterogeneity is stronger, however, when these terms are tested collectively using the linear.hypothesis function: > (coefs <- rownames(coef(rohwer.mod2))) [1] "(Intercept)" "SESLo" "n" "s" "ns" [6] "na" "ss" "SESLo:n" "SESLo:s" "SESLo:ns" [11] "SESLo:na" "SESLo:ss" > print(linear.hypothesis(rohwer.mod2, coefs[grep(":", coefs)]), SSP=FALSE) Multivariate Tests: Df test stat approx F num Df den Df Pr(>F) Pillai 5.0000 0.417938 1.845226 15.0000 171.0000 0.0320861 * Wilks 5.0000 0.623582 1.893613 15.0000 152.2322 0.0276949 * Hotelling-Lawley 5.0000 0.538651 1.927175 15.0000 161.0000 0.0239619 * Roy 5.0000 0.384649 4.384997 5.0000 57.0000 0.0019053 ** --- Signif. codes: 0 ’***’ 0.001 ’**’ 0.01 ’*’ 0.05 ’.’ 0.1 ’ ’ 1 8