正在加载图片...

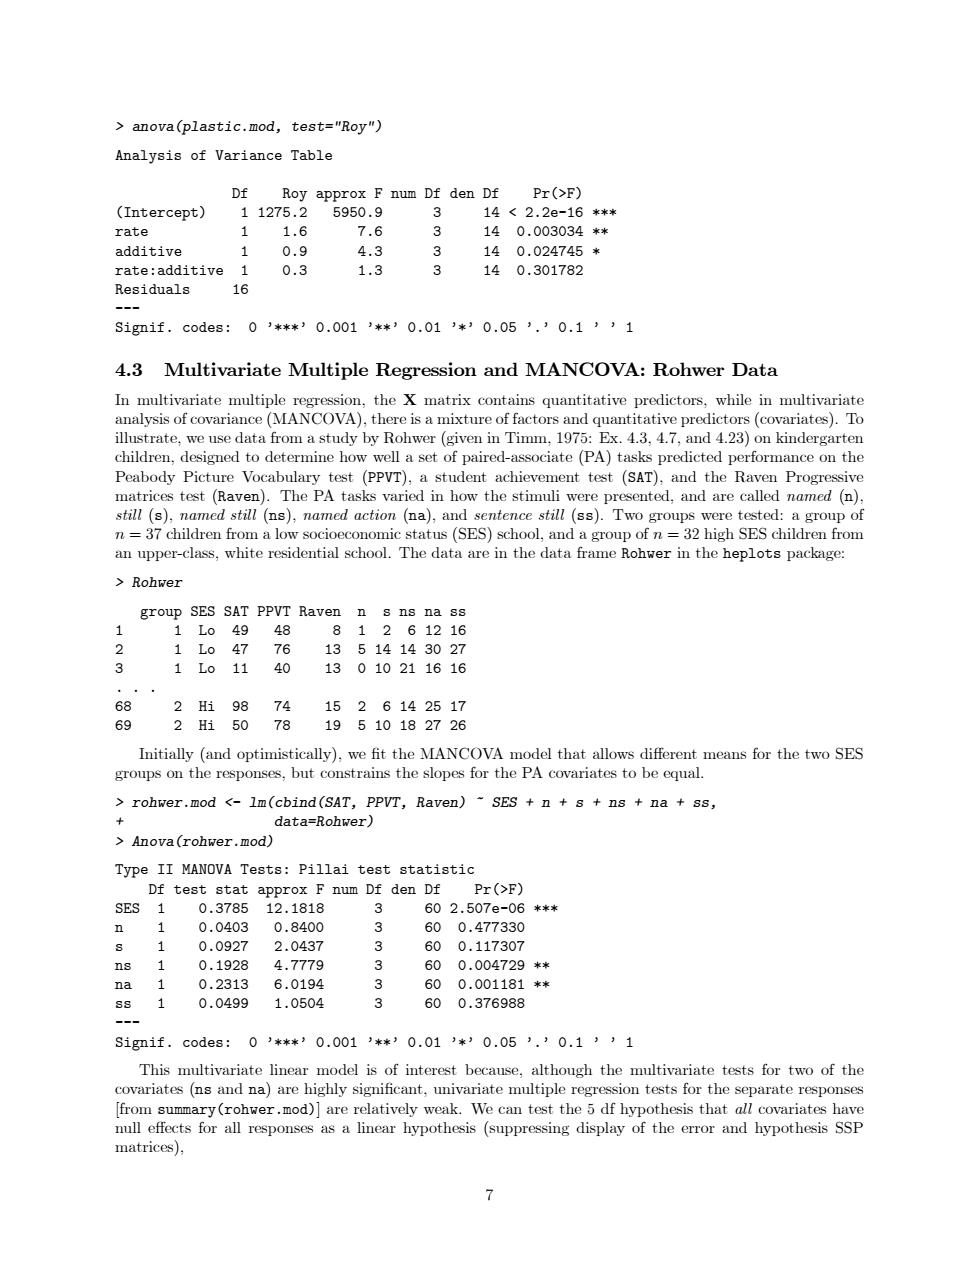
anova(plastic.mod,test="Roy") Analysis of Variance Table Df Roy approx F num Df den Df Pr(>F) (Intercept) 11275.2 5950.9 心 14<2.2e-16*** rate 1.6 7.6 3 140.003034* additive 1 0.9 4.3 3 14 0.024745* rate:additive 1 0.3 1.3 3 140.301782 Residuals 16 S1gnif.c0de8:0’***)0.001’**30.013*’0.05’.10.13’1 4.3 Multivariate Multiple Regression and MANCOVA:Rohwer Data In multivariate multiple regression,the X matrix contains quantitative predictors,while in multivariate analysis of covariance(MANCOVA),there is a mixture of factors and quantitative predictors(covariates).To illustrate,we use data from a study by Rohwer(given in Timm,1975:Ex.4.3,4.7,and 4.23)on kindergarten children,designed to determine how well a set of paired-associate (PA)tasks predicted performance on the Peabody Picture Vocabulary test (PPVT),a student achievement test (SAT),and the Raven Progressive matrices test (Raven).The PA tasks varied in how the stimuli were presented,and are called named (n), still (s),named still (ns),named action (na),and sentence still(ss).Two groups were tested:a group of n =37 children from a low socioeconomic status(SES)school,and a group of n 32 high SES children from an upper-class,white residential school.The data are in the data frame Rohwer in the heplots package: Rohwer group SES SAT PPVT Raven n s ns na ss 1L049 48 81261216 2 1L047 76 13514143027 3 1L011 40 13010211616 68 2Hi98 74 1526142517 69 2H15078 19510182726 Initially (and optimistically),we fit the MANCOVA model that allows different means for the two SES groups on the responses,but constrains the slopes for the PA covariates to be equal. rohwer.mod <-1m(cbind(SAT,PPVT,Raven)-SES n +s ns na ss, data=Rohwer) Anova(rohwer.mod) Type II MANOVA Tests:Pillai test statistic Df test stat approx F num Df den Df Pr(>F) SES 1 0.378512.1818 602.507e-06*** ◇ 1 0.0403 0.8400 3 60 0.477330 8 0.0927 2.0437 600.117307 ns 1 0.1928 4.7779 600.004729** na 1 0.2313 6.0194 600.001181** 88 1 0.0499 1.0504 3 600.376988 S1gmif.codes:0’**’0.001’*’0.01’*’0.05’.’0.1’’1 This multivariate linear model is of interest because,although the multivariate tests for two of the covariates (ns and na)are highly significant.univariate multiple regression tests for the separate responses [from summary(rohwer.mod)]are relatively weak.We can test the 5 df hypothesis that all covariates have null effects for all responses as a linear hypothesis (suppressing display of the error and hypothesis SSP matrices),> anova(plastic.mod, test="Roy") Analysis of Variance Table Df Roy approx F num Df den Df Pr(>F) (Intercept) 1 1275.2 5950.9 3 14 < 2.2e-16 *** rate 1 1.6 7.6 3 14 0.003034 ** additive 1 0.9 4.3 3 14 0.024745 * rate:additive 1 0.3 1.3 3 14 0.301782 Residuals 16 --- Signif. codes: 0 ’***’ 0.001 ’**’ 0.01 ’*’ 0.05 ’.’ 0.1 ’ ’ 1 4.3 Multivariate Multiple Regression and MANCOVA: Rohwer Data In multivariate multiple regression, the X matrix contains quantitative predictors, while in multivariate analysis of covariance (MANCOVA), there is a mixture of factors and quantitative predictors (covariates). To illustrate, we use data from a study by Rohwer (given in Timm, 1975: Ex. 4.3, 4.7, and 4.23) on kindergarten children, designed to determine how well a set of paired-associate (PA) tasks predicted performance on the Peabody Picture Vocabulary test (PPVT), a student achievement test (SAT), and the Raven Progressive matrices test (Raven). The PA tasks varied in how the stimuli were presented, and are called named (n), still (s), named still (ns), named action (na), and sentence still (ss). Two groups were tested: a group of n = 37 children from a low socioeconomic status (SES) school, and a group of n = 32 high SES children from an upper-class, white residential school. The data are in the data frame Rohwer in the heplots package: > Rohwer group SES SAT PPVT Raven n s ns na ss 1 1 Lo 49 48 8 1 2 6 12 16 2 1 Lo 47 76 13 5 14 14 30 27 3 1 Lo 11 40 13 0 10 21 16 16 ... 68 2 Hi 98 74 15 2 6 14 25 17 69 2 Hi 50 78 19 5 10 18 27 26 Initially (and optimistically), we fit the MANCOVA model that allows different means for the two SES groups on the responses, but constrains the slopes for the PA covariates to be equal. > rohwer.mod <- lm(cbind(SAT, PPVT, Raven) ~ SES + n + s + ns + na + ss, + data=Rohwer) > Anova(rohwer.mod) Type II MANOVA Tests: Pillai test statistic Df test stat approx F num Df den Df Pr(>F) SES 1 0.3785 12.1818 3 60 2.507e-06 *** n 1 0.0403 0.8400 3 60 0.477330 s 1 0.0927 2.0437 3 60 0.117307 ns 1 0.1928 4.7779 3 60 0.004729 ** na 1 0.2313 6.0194 3 60 0.001181 ** ss 1 0.0499 1.0504 3 60 0.376988 --- Signif. codes: 0 ’***’ 0.001 ’**’ 0.01 ’*’ 0.05 ’.’ 0.1 ’ ’ 1 This multivariate linear model is of interest because, although the multivariate tests for two of the covariates (ns and na) are highly significant, univariate multiple regression tests for the separate responses [from summary(rohwer.mod)] are relatively weak. We can test the 5 df hypothesis that all covariates have null effects for all responses as a linear hypothesis (suppressing display of the error and hypothesis SSP matrices), 7