正在加载图片...
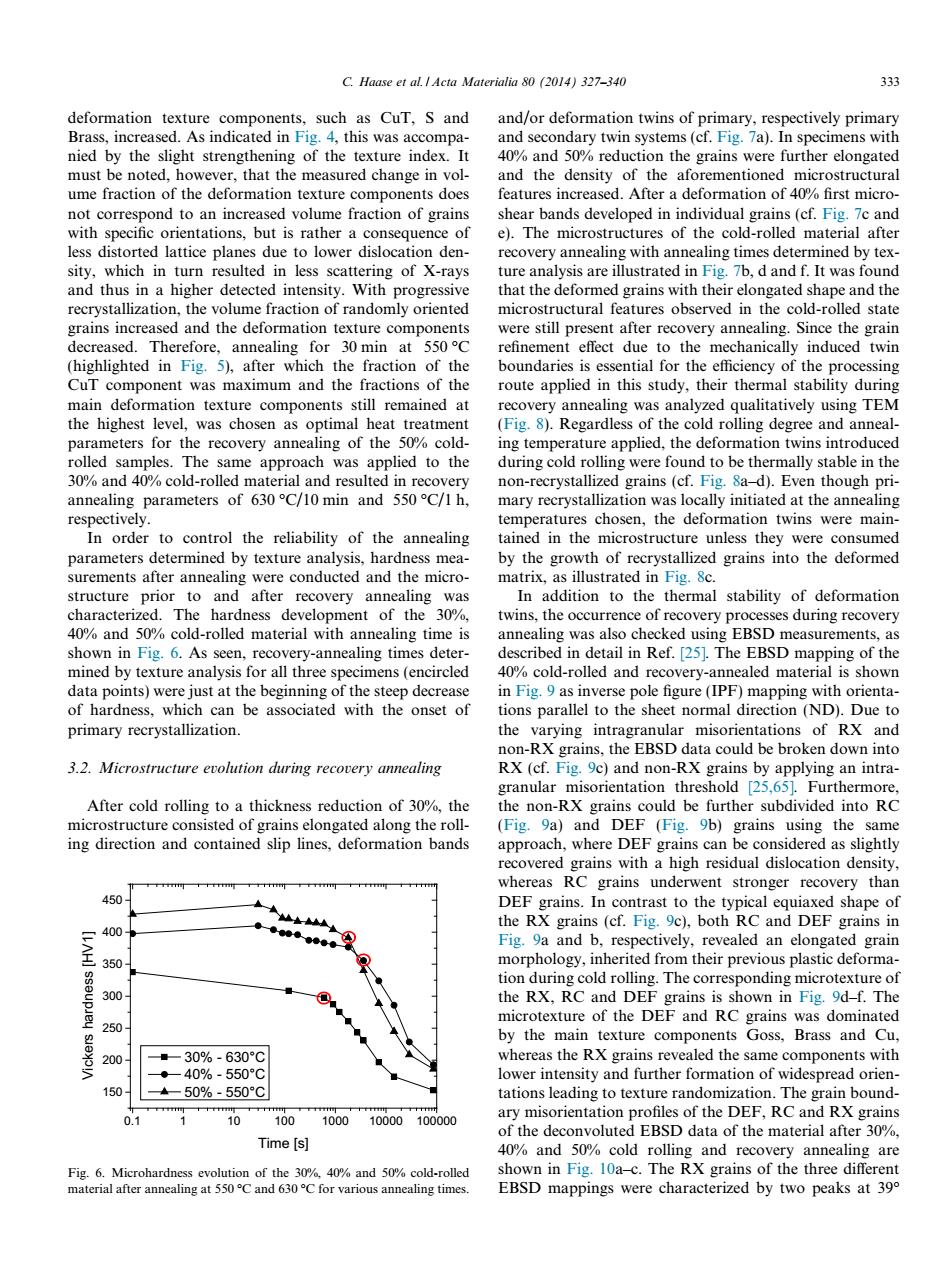
C.Haase et al.Acta Materialia 80 (2014)327-340 333 deformation texture components.such as CuT,S and and/or deformation twins of primary,respectively primary Brass,increased.As indicated in Fig.4,this was accompa- and secondary twin systems(cf.Fig.7a).In specimens with nied by the slight strengthening of the texture index.It 40%and 50%reduction the grains were further elongated must be noted.however,that the measured change in vol- and the density of the aforementioned microstructural ume fraction of the deformation texture components does features increased.After a deformation of 40%first micro- not correspond to an increased volume fraction of grains shear bands developed in individual grains(cf.Fig.7c and with specific orientations,but is rather a consequence of e).The microstructures of the cold-rolled material after less distorted lattice planes due to lower dislocation den- recovery annealing with annealing times determined by tex- sity,which in turn resulted in less scattering of X-rays ture analysis are illustrated in Fig.7b,d and f.It was found and thus in a higher detected intensity.With progressive that the deformed grains with their elongated shape and the recrystallization,the volume fraction of randomly oriented microstructural features observed in the cold-rolled state grains increased and the deformation texture components were still present after recovery annealing.Since the grain decreased.Therefore,annealing for 30 min at 550C refinement effect due to the mechanically induced twin (highlighted in Fig.5),after which the fraction of the boundaries is essential for the efficiency of the processing CuT component was maximum and the fractions of the route applied in this study,their thermal stability during main deformation texture components still remained at recovery annealing was analyzed qualitatively using TEM the highest level,was chosen as optimal heat treatment (Fig.8).Regardless of the cold rolling degree and anneal- parameters for the recovery annealing of the 50%cold- ing temperature applied,the deformation twins introduced rolled samples.The same approach was applied to the during cold rolling were found to be thermally stable in the 30%and 40%cold-rolled material and resulted in recovery non-recrystallized grains(cf.Fig.Sa-d).Even though pri- annealing parameters of 630C/10 min and 550C/1 h, mary recrystallization was locally initiated at the annealing respectively. temperatures chosen,the deformation twins were main- In order to control the reliability of the annealing tained in the microstructure unless they were consumed parameters determined by texture analysis,hardness mea- by the growth of recrystallized grains into the deformed surements after annealing were conducted and the micro- matrix,as illustrated in Fig.8c. structure prior to and after recovery annealing was In addition to the thermal stability of deformation characterized.The hardness development of the 30%. twins,the occurrence of recovery processes during recovery 40%and 50%cold-rolled material with annealing time is annealing was also checked using EBSD measurements,as shown in Fig.6.As seen,recovery-annealing times deter- described in detail in Ref.[25].The EBSD mapping of the mined by texture analysis for all three specimens (encircled 40%cold-rolled and recovery-annealed material is shown data points)were just at the beginning of the steep decrease in Fig.9 as inverse pole figure(IPF)mapping with orienta- of hardness,which can be associated with the onset of tions parallel to the sheet normal direction (ND).Due to primary recrystallization. the varying intragranular misorientations of RX and non-RX grains,the EBSD data could be broken down into 3.2.Microstructure evolution during recovery annealing RX(cf.Fig.9c)and non-RX grains by applying an intra- granular misorientation threshold [25,65].Furthermore, After cold rolling to a thickness reduction of 30%,the the non-RX grains could be further subdivided into RC microstructure consisted of grains elongated along the roll- (Fig.9a)and DEF (Fig.9b)grains using the same ing direction and contained slip lines,deformation bands approach,where DEF grains can be considered as slightly recovered grains with a high residual dislocation density, whereas RC grains underwent stronger recovery than 450 DEF grains.In contrast to the typical equiaxed shape of the RX grains(cf.Fig.9c),both RC and DEF grains in 400 [LAH] Fig.9a and b,respectively,revealed an elongated grain 350 morphology,inherited from their previous plastic deforma- tion during cold rolling.The corresponding microtexture of 300 the RX,RC and DEF grains is shown in Fig.9d-f.The microtexture of the DEF and RC grains was dominated 250 by the main texture components Goss,Brass and Cu, 200 ■一30%-630°C whereas the RX grains revealed the same components with 。-40%-550°C lower intensity and further formation of widespread orien- 150 +50%-550°℃ tations leading to texture randomization.The grain bound- 0.1 0 1 00 100010000100000 ary misorientation profiles of the DEF,RC and RX grains of the deconvoluted EBSD data of the material after 30%. Time [s] 40%and 50%cold rolling and recovery annealing are Fig.6.Microhardness evolution of the 30%,40%and 50%cold-rolled shown in Fig.10a-c.The RX grains of the three different material after annealing at 550C and 630C for various annealing times. EBSD mappings were characterized by two peaks at 390deformation texture components, such as CuT, S and Brass, increased. As indicated in Fig. 4, this was accompanied by the slight strengthening of the texture index. It must be noted, however, that the measured change in volume fraction of the deformation texture components does not correspond to an increased volume fraction of grains with specific orientations, but is rather a consequence of less distorted lattice planes due to lower dislocation density, which in turn resulted in less scattering of X-rays and thus in a higher detected intensity. With progressive recrystallization, the volume fraction of randomly oriented grains increased and the deformation texture components decreased. Therefore, annealing for 30 min at 550 C (highlighted in Fig. 5), after which the fraction of the CuT component was maximum and the fractions of the main deformation texture components still remained at the highest level, was chosen as optimal heat treatment parameters for the recovery annealing of the 50% coldrolled samples. The same approach was applied to the 30% and 40% cold-rolled material and resulted in recovery annealing parameters of 630 C/10 min and 550 C/1 h, respectively. In order to control the reliability of the annealing parameters determined by texture analysis, hardness measurements after annealing were conducted and the microstructure prior to and after recovery annealing was characterized. The hardness development of the 30%, 40% and 50% cold-rolled material with annealing time is shown in Fig. 6. As seen, recovery-annealing times determined by texture analysis for all three specimens (encircled data points) were just at the beginning of the steep decrease of hardness, which can be associated with the onset of primary recrystallization. 3.2. Microstructure evolution during recovery annealing After cold rolling to a thickness reduction of 30%, the microstructure consisted of grains elongated along the rolling direction and contained slip lines, deformation bands and/or deformation twins of primary, respectively primary and secondary twin systems (cf. Fig. 7a). In specimens with 40% and 50% reduction the grains were further elongated and the density of the aforementioned microstructural features increased. After a deformation of 40% first microshear bands developed in individual grains (cf. Fig. 7c and e). The microstructures of the cold-rolled material after recovery annealing with annealing times determined by texture analysis are illustrated in Fig. 7b, d and f. It was found that the deformed grains with their elongated shape and the microstructural features observed in the cold-rolled state were still present after recovery annealing. Since the grain refinement effect due to the mechanically induced twin boundaries is essential for the efficiency of the processing route applied in this study, their thermal stability during recovery annealing was analyzed qualitatively using TEM (Fig. 8). Regardless of the cold rolling degree and annealing temperature applied, the deformation twins introduced during cold rolling were found to be thermally stable in the non-recrystallized grains (cf. Fig. 8a–d). Even though primary recrystallization was locally initiated at the annealing temperatures chosen, the deformation twins were maintained in the microstructure unless they were consumed by the growth of recrystallized grains into the deformed matrix, as illustrated in Fig. 8c. In addition to the thermal stability of deformation twins, the occurrence of recovery processes during recovery annealing was also checked using EBSD measurements, as described in detail in Ref. [25]. The EBSD mapping of the 40% cold-rolled and recovery-annealed material is shown in Fig. 9 as inverse pole figure (IPF) mapping with orientations parallel to the sheet normal direction (ND). Due to the varying intragranular misorientations of RX and non-RX grains, the EBSD data could be broken down into RX (cf. Fig. 9c) and non-RX grains by applying an intragranular misorientation threshold [25,65]. Furthermore, the non-RX grains could be further subdivided into RC (Fig. 9a) and DEF (Fig. 9b) grains using the same approach, where DEF grains can be considered as slightly recovered grains with a high residual dislocation density, whereas RC grains underwent stronger recovery than DEF grains. In contrast to the typical equiaxed shape of the RX grains (cf. Fig. 9c), both RC and DEF grains in Fig. 9a and b, respectively, revealed an elongated grain morphology, inherited from their previous plastic deformation during cold rolling. The corresponding microtexture of the RX, RC and DEF grains is shown in Fig. 9d–f. The microtexture of the DEF and RC grains was dominated by the main texture components Goss, Brass and Cu, whereas the RX grains revealed the same components with lower intensity and further formation of widespread orientations leading to texture randomization. The grain boundary misorientation profiles of the DEF, RC and RX grains of the deconvoluted EBSD data of the material after 30%, 40% and 50% cold rolling and recovery annealing are shown in Fig. 10a–c. The RX grains of the three different EBSD mappings were characterized by two peaks at 39 0.1 1 10 100 1000 10000 100000 150 200 250 300 350 400 450 Vickers hardness [HV1] Time [s] 30% - 630°C 40% - 550°C 50% - 550°C Fig. 6. Microhardness evolution of the 30%, 40% and 50% cold-rolled material after annealing at 550 C and 630 C for various annealing times. C. Haase et al. / Acta Materialia 80 (2014) 327–340 333������