正在加载图片...
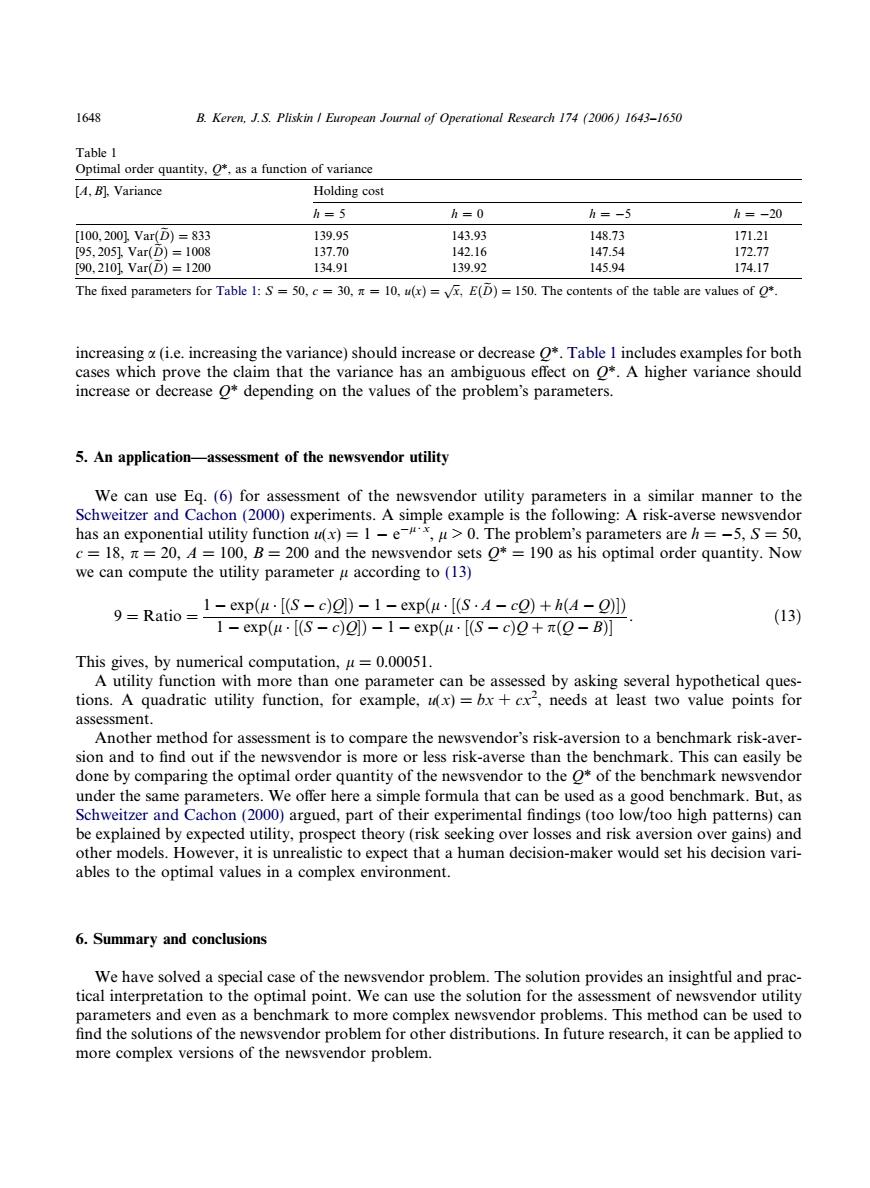
1648 B.Keren,J.S.Pliskin European Journal of Operational Research 174 (2006)1643-1650 Table 1 Optimal order quantity.as a function of variance [A,B].Variance Holding cost h=5 h=0 h=-5 h=-20 [100,2001,Var(D)=833 139.95 143.93 148.73 171.21 [95,205].Var(D)=1008 137.70 142.16 147.54 172.77 [90,210]Var(D)=1200 134.91 139.92 145.94 174.17 The fixed parameters for Table 1:S=50,c=30,=10,u(x)=v,E(D)=150.The contents of the table are values of o*. increasing a(i.e.increasing the variance)should increase or decrease O*.Table I includes examples for both cases which prove the claim that the variance has an ambiguous effect on O*.A higher variance should increase or decrease O*depending on the values of the problem's parameters. 5.An application-assessment of the newsvendor utility We can use Eq.(6)for assessment of the newsvendor utility parameters in a similar manner to the Schweitzer and Cachon (2000)experiments.A simple example is the following:A risk-averse newsvendor has an exponential utility function u(x)=1 -e#*,u>0.The problem's parameters are h=-5,S=50, c=18,n=20,A =100,B=200 and the newsvendor sets O*=190 as his optimal order quantity.Now we can compute the utility parameter u according to(13) 9=Ratio = 1-exp(u·[(S-c)g)-1-exp(u·I(S·A-c2)+h(A-]) (13) 1-exp(u·[S-c)g])-1-exp(u·[(S-c)2+π(Q-B)] This gives,by numerical computation,u=0.00051. A utility function with more than one parameter can be assessed by asking several hypothetical ques- tions.A quadratic utility function,for example,ux)=bx+cx2,needs at least two value points for assessment. Another method for assessment is to compare the newsvendor's risk-aversion to a benchmark risk-aver- sion and to find out if the newsvendor is more or less risk-averse than the benchmark.This can easily be done by comparing the optimal order quantity of the newsvendor to the O*of the benchmark newsvendor under the same parameters.We offer here a simple formula that can be used as a good benchmark.But,as Schweitzer and Cachon(2000)argued,part of their experimental findings(too low/too high patterns)can be explained by expected utility,prospect theory(risk seeking over losses and risk aversion over gains)and other models.However,it is unrealistic to expect that a human decision-maker would set his decision vari- ables to the optimal values in a complex environment. 6.Summary and conclusions We have solved a special case of the newsvendor problem.The solution provides an insightful and prac- tical interpretation to the optimal point.We can use the solution for the assessment of newsvendor utility parameters and even as a benchmark to more complex newsvendor problems.This method can be used to find the solutions of the newsvendor problem for other distributions.In future research,it can be applied to more complex versions of the newsvendor problem.increasing a (i.e. increasing the variance) should increase or decrease Q*. Table 1 includes examples for both cases which prove the claim that the variance has an ambiguous effect on Q*. A higher variance should increase or decrease Q* depending on the values of the problems parameters. 5. An application—assessment of the newsvendor utility We can use Eq. (6) for assessment of the newsvendor utility parameters in a similar manner to the Schweitzer and Cachon (2000) experiments. A simple example is the following: A risk-averse newsvendor has an exponential utility function u(x)=1 e l Æ x , l > 0. The problems parameters are h = 5, S = 50, c = 18, p = 20, A = 100, B = 200 and the newsvendor sets Q* = 190 as his optimal order quantity. Now we can compute the utility parameter l according to (13) 9 ¼ Ratio ¼ 1 expðl ½ðS cÞQÞ 1 expðl ½ðS A cQÞ þ hðA QÞÞ 1 expðl ½ðS cÞQÞ 1 expðl ½ðS cÞQ þ pðQ BÞ . ð13Þ This gives, by numerical computation, l = 0.00051. A utility function with more than one parameter can be assessed by asking several hypothetical questions. A quadratic utility function, for example, u(x) = bx + cx2 , needs at least two value points for assessment. Another method for assessment is to compare the newsvendors risk-aversion to a benchmark risk-aversion and to find out if the newsvendor is more or less risk-averse than the benchmark. This can easily be done by comparing the optimal order quantity of the newsvendor to the Q* of the benchmark newsvendor under the same parameters. We offer here a simple formula that can be used as a good benchmark. But, as Schweitzer and Cachon (2000) argued, part of their experimental findings (too low/too high patterns) can be explained by expected utility, prospect theory (risk seeking over losses and risk aversion over gains) and other models. However, it is unrealistic to expect that a human decision-maker would set his decision variables to the optimal values in a complex environment. 6. Summary and conclusions We have solved a special case of the newsvendor problem. The solution provides an insightful and practical interpretation to the optimal point. We can use the solution for the assessment of newsvendor utility parameters and even as a benchmark to more complex newsvendor problems. This method can be used to find the solutions of the newsvendor problem for other distributions. In future research, it can be applied to more complex versions of the newsvendor problem. Table 1 Optimal order quantity, Q*, as a function of variance [A, B], Variance Holding cost h = 5 h = 0 h = 5 h = 20 [100, 200], VarðDeÞ ¼ 833 139.95 143.93 148.73 171.21 [95, 205], VarðDeÞ ¼ 1008 137.70 142.16 147.54 172.77 [90, 210], VarðDeÞ ¼ 1200 134.91 139.92 145.94 174.17 The fixed parameters for Table 1: S = 50, c = 30, p = 10, uðxÞ ¼ ffiffi x p ; EðDeÞ ¼ 150. The contents of the table are values of Q*. 1648 B. Keren, J.S. Pliskin / European Journal of Operational Research 174 (2006) 1643–1650�������������������������