正在加载图片...

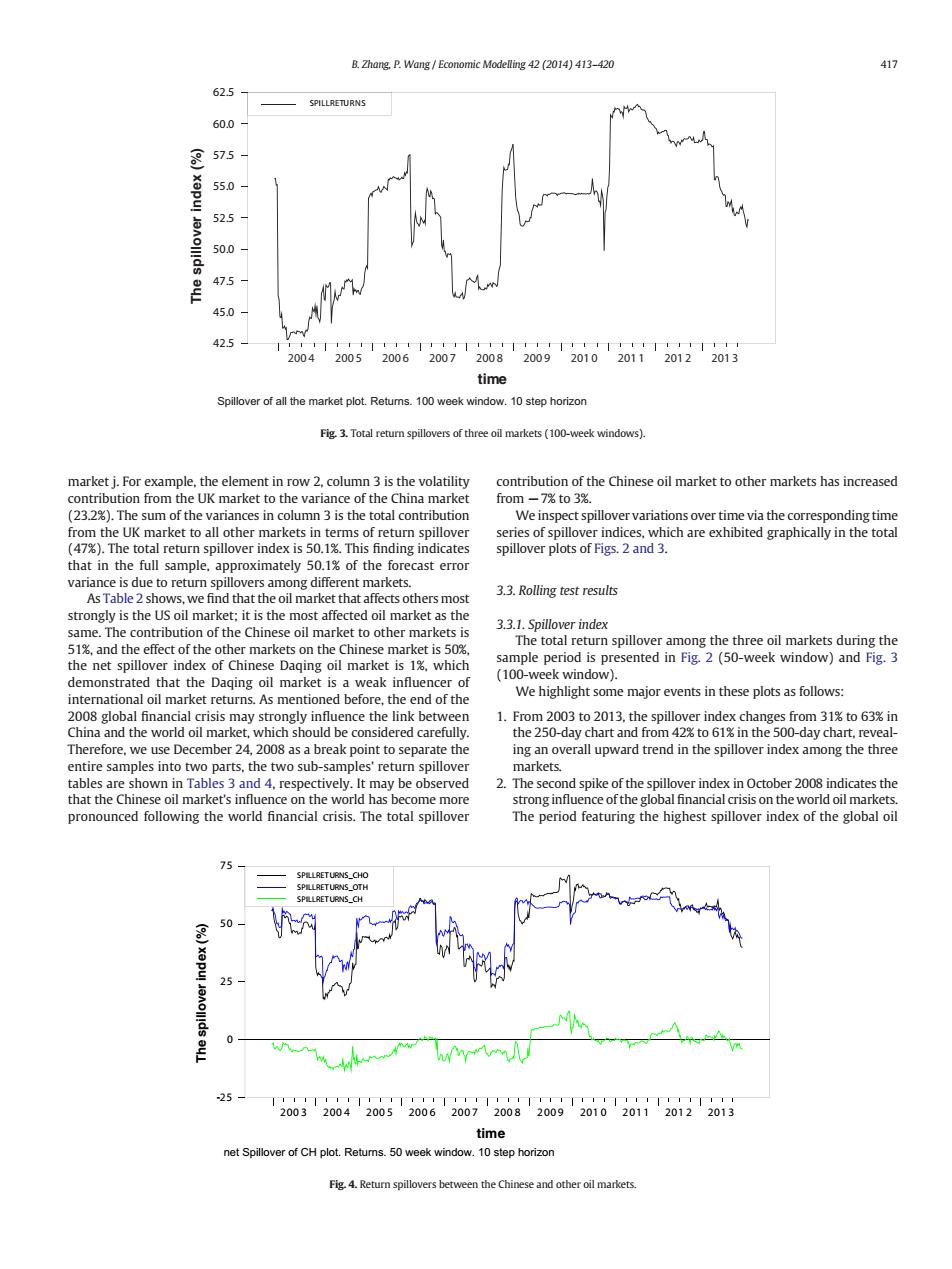
B.Zhang,P.Wang Economic Modelling 42 (2014)413-420 417 62.5 SPILLRETURNS 60.0 8 575 apu 55.0 52.5 JaAolllds 50.0 47.5 45.0 425 11111111111111111111111111111111111 2004 2005 2006 2007 2008 200920102011 2012 2013 time Spillover of all the market plot.Retums.100 week window.10 step horizon Fig.3.Total return spillovers of three oil markets (100-week windows). market j.For example,the element in row 2,column 3 is the volatility contribution of the Chinese oil market to other markets has increased contribution from the UK market to the variance of the China market from-7%to 3%. (23.2%).The sum of the variances in column 3 is the total contribution We inspect spillover variations over time via the corresponding time from the UK market to all other markets in terms of return spillover series of spillover indices,which are exhibited graphically in the total (47%).The total return spillover index is 50.1%.This finding indicates spillover plots of Figs.2 and 3. that in the full sample,approximately 50.1%of the forecast error variance is due to return spillovers among different markets. As Table 2 shows,we find that the oil market that affects others most 3.3.Rolling test results strongly is the US oil market;it is the most affected oil market as the same.The contribution of the Chinese oil market to other markets is 3.3.1.Spillover index The total return spillover among the three oil markets during the 51%,and the effect of the other markets on the Chinese market is 50% the net spillover index of Chinese Daging oil market is 1%,which sample period is presented in Fig.2(50-week window)and Fig.3 demonstrated that the Daging oil market is a weak influencer of (100-week window). international oil market returns.As mentioned before,the end of the We highlight some major events in these plots as follows: 2008 global financial crisis may strongly influence the link between 1.From 2003 to 2013,the spillover index changes from 31%to 63%in China and the world oil market,which should be considered carefully. the 250-day chart and from 42%to 61%in the 500-day chart,reveal- Therefore,we use December 24,2008 as a break point to separate the ing an overall upward trend in the spillover index among the three entire samples into two parts,the two sub-samples'return spillover markets. tables are shown in Tables 3 and 4,respectively.It may be observed 2.The second spike of the spillover index in October 2008 indicates the that the Chinese oil market's influence on the world has become more strong influence of the global financial crisis on the world oil markets. pronounced following the world financial crisis.The total spillover The period featuring the highest spillover index of the global oil 75 SPRLLRETURNS_CHO SPLLRETURNS_CH 50 25 olllds 25 1111111厂111111厂111111厂11 2003200420052006200720082009201020112012 2013 time net Spillover of CH plot.Retums.50 week window.10 step horizon Fig.4.Return spillovers between the Chinese and other oil markets.market j. For example, the element in row 2, column 3 is the volatility contribution from the UK market to the variance of the China market (23.2%). The sum of the variances in column 3 is the total contribution from the UK market to all other markets in terms of return spillover (47%). The total return spillover index is 50.1%. This finding indicates that in the full sample, approximately 50.1% of the forecast error variance is due to return spillovers among different markets. As Table 2 shows, we find that the oil market that affects others most strongly is the US oil market; it is the most affected oil market as the same. The contribution of the Chinese oil market to other markets is 51%, and the effect of the other markets on the Chinese market is 50%, the net spillover index of Chinese Daqing oil market is 1%, which demonstrated that the Daqing oil market is a weak influencer of international oil market returns. As mentioned before, the end of the 2008 global financial crisis may strongly influence the link between China and the world oil market, which should be considered carefully. Therefore, we use December 24, 2008 as a break point to separate the entire samples into two parts, the two sub-samples' return spillover tables are shown in Tables 3 and 4, respectively. It may be observed that the Chinese oil market's influence on the world has become more pronounced following the world financial crisis. The total spillover contribution of the Chinese oil market to other markets has increased from −7% to 3%. We inspect spillover variations over time via the corresponding time series of spillover indices, which are exhibited graphically in the total spillover plots of Figs. 2 and 3. 3.3. Rolling test results 3.3.1. Spillover index The total return spillover among the three oil markets during the sample period is presented in Fig. 2 (50-week window) and Fig. 3 (100-week window). We highlight some major events in these plots as follows: 1. From 2003 to 2013, the spillover index changes from 31% to 63% in the 250-day chart and from 42% to 61% in the 500-day chart, revealing an overall upward trend in the spillover index among the three markets. 2. The second spike of the spillover index in October 2008 indicates the strong influence of the global financial crisis on the world oil markets. The period featuring the highest spillover index of the global oil time The spillover index (%) 200 4 200 5 200 6 200 7 200 8 200 9 201 0 201 1 201 2 201 3 42.5 45.0 47.5 50.0 52.5 55.0 57.5 60.0 62.5 SPILLRETURNS Spillover of all the market plot. Returns. 100 week window. 10 step horizon Fig. 3. Total return spillovers of three oil markets (100-week windows). time The spillover index (%) 200 3 200 4 200 5 200 6 200 7 200 8 2009 201 0 2011 201 2 201 3 -25 0 25 50 75 net Spillover of CH plot. Returns. 50 week window. 10 step horizon SPILLRETURNS_CHO SPILLRETURNS_OTH SPILLRETURNS_CH Fig. 4. Return spillovers between the Chinese and other oil markets. B. Zhang, P. Wang / Economic Modelling 42 (2014) 413–420 417