正在加载图片...
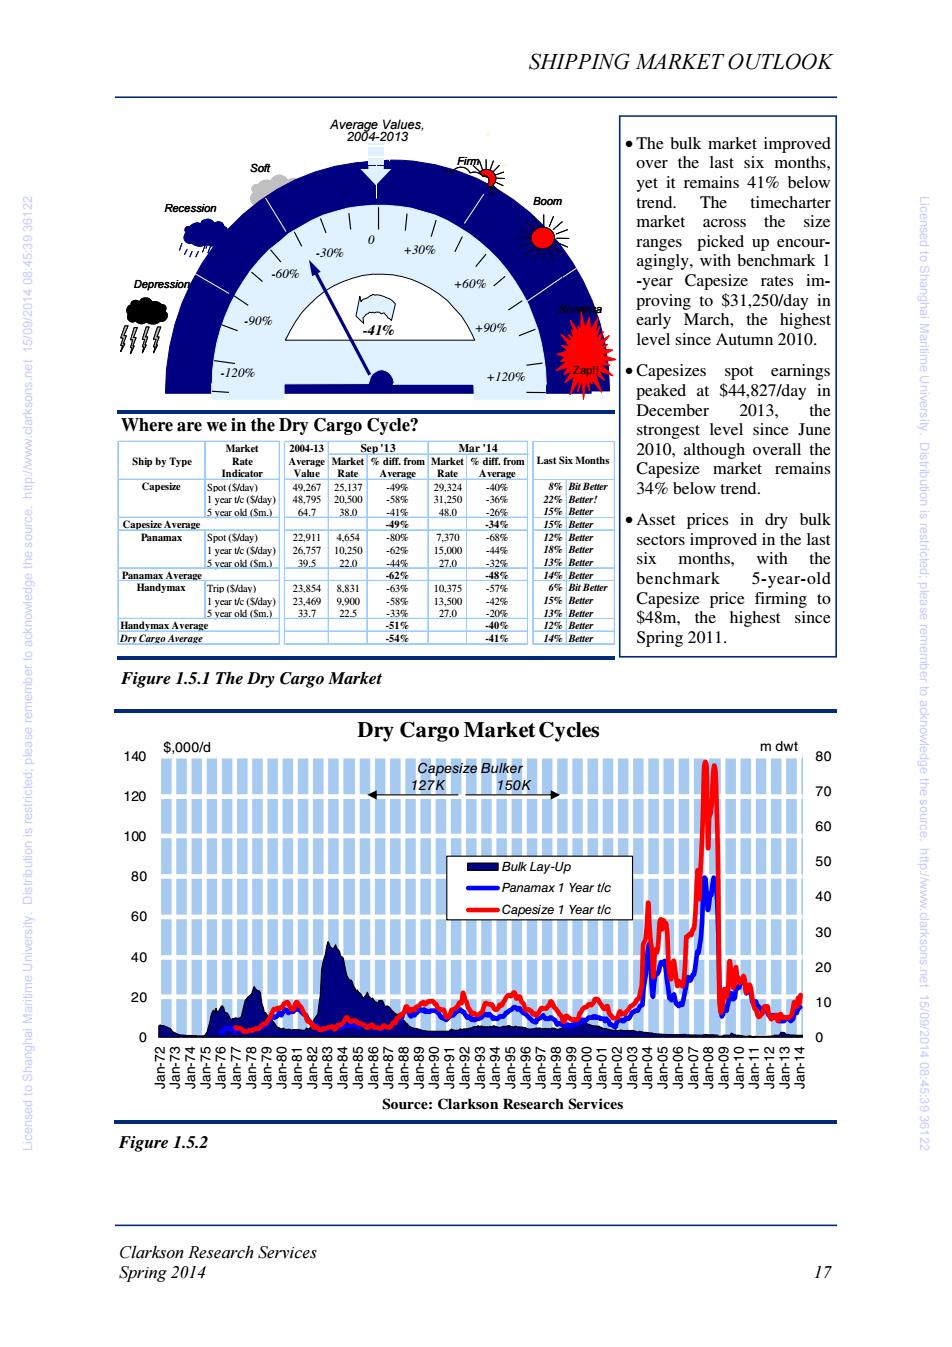
SHIPPING MARKET OUTLOOK Average Values. 2004-2013 The bulk market improved F女 over the last six months. yet it remains 41%below Recession Boom trend.The timecharter market across the size 6E:St:80102/60/9L lou suosyep'MM +30% ranges picked up encour- agingly,with benchmark 1 60% +60% -year Capesize rates im- proving to $31,250/day in -90% -41% +90% early March,the highest level since Autumn 2010. 120% +120% .Capesizes spot earnings peaked at $44,827/day in December 2013,the Where are we in the Dry Cargo Cycle? strongest level since June Market 2004-13 Sep'13 Mar'14 2010,although overall the Ship by Type Rate Average Market diff.from Market diff.from Last Six Months Indicator Rate Average Rate Average Capesize market remains Capesize Spot ($/day) 49,267 25.137 -49 29.324 -40 34%below trend. I vear tc (S/dav) 48.795 20.500 -58% 31.250 -36凳 22%e Better! Dis tribution is 5 vear old (Sm.) 64.7 380 -41% 48.0 -26% 15%Better Capesize Average 49% .34 15%Better .Asset prices in dry bulk Panamax Spot (S/day) 22,911 4,654 - 7.370 -68% 12% 1 year tic ($/day) 18%Better sectors improved in the last 26,757 10.250 -62 15,000 44侵 5 vear old (Sm) 395 220 -44% 270 .32% 13 Better six months, with the restricted; anamax Average 62 48% Handymax benchmark 5-year-old Trip(ia) 23.854 8.83 -637 10.375 57% I vear t/c (Vdav) 23.469 9.900 .589 13.500 423 15% Better Capesize price firming to 5 vear old (Sm.) 33.7 225 .33 27.0 -20% 13% Better $48m.the highest since please Handymax Averag 51 40% 12%Better Dry Cargo Average 54% 41% Spring 2011. Figure 1.5.1 The Dry Cargo Market Dry Cargo Market Cycles $,000/d m dwt 140 80 Capesize Bulker 127K 150K 120 10 remember to acknowledge the sourde. 60 100 ■Bulk Lay-Up 50 80 Panamax 1 Year t/c 40 60 Capesize 1 Year t/c 30 40 20 20 10 0 ?寸?FP品6删品$品品6品88588高号号68885g8莒吕8688=y巴± http://www.clarksons.net 15/09/2014 08:45:3936122 Source:Clarkson Research Services Figure 1.5.2 Clarkson Research Services Spring 2014 17Clarkson Research Services Spring 2014 17 SHIPPING MARKET OUTLOOK Figure 1.5.2 Figure 1.5.1 The Dry Cargo Market • The bulk market improved over the last six months, yet it remains 41% below trend. The timecharter market across the size ranges picked up encouragingly, with benchmark 1 -year Capesize rates improving to $31,250/day in early March, the highest level since Autumn 2010. • Capesizes spot earnings peaked at $44,827/day in December 2013, the strongest level since June 2010, although overall the Capesize market remains 34% below trend. • Asset prices in dry bulk sectors improved in the last six months, with the benchmark 5-year-old Capesize price firming to $48m, the highest since Spring 2011. Where are we in the Dry Cargo Cycle? Market 2004-13 Ship by Type Rate Average Market % diff. from Market % diff. from Indicator Value Rate Average Rate Average Capesize Spot ($/day) 49,267 25,137 -49% 29,324 -40% 8% Bit Better 1 year t/c ($/day) 48,795 20,500 -58% 31,250 -36% 22% Better! 5 year old ($m.) 64.7 38.0 -41% 48.0 -26% 15% Better Capesize Average -49% -34% 15% Better Panamax Spot ($/day) 22,911 4,654 -80% 7,370 -68% 12% Better 1 year t/c ($/day) 26,757 10,250 -62% 15,000 -44% 18% Better 5 year old ($m.) 39.5 22.0 -44% 27.0 -32% 13% Better Panamax Average -62% -48% 14% Better Handymax Trip ($/day) 23,854 8,831 -63% 10,375 -57% 6% Bit Better 1 year t/c ($/day) 23,469 9,900 -58% 13,500 -42% 15% Better 5 year old ($m.) 33.7 22.5 -33% 27.0 -20% 13% Better Handymax Average -51% -40% 12% Better Dry Cargo Average -54% -41% 14% Better Sep '13 Mar '14 Last Six Months 0 10 20 30 40 50 60 70 80 0 20 40 60 80 100 120 140 Jan-72 Jan-73 Jan-74 Jan-75 Jan-76 Jan-77 Jan-78 Jan-79 Jan-80 Jan-81 Jan-82 Jan-83 Jan-84 Jan-85 Jan-86 Jan-87 Jan-88 Jan-89 Jan-90 Jan-91 Jan-92 Jan-93 Jan-94 Jan-95 Jan-96 Jan-97 Jan-98 Jan-99 Jan-00 Jan-01 Jan-02 Jan-03 Jan-04 Jan-05 Jan-06 Jan-07 Jan-08 Jan-09 Jan-10 Jan-11 Jan-12 Jan-13 Jan-14 $,000/d m dwt Source: Clarkson Research Services Dry Cargo Market Cycles Bulk Lay-Up Panamax 1 Year t/c Capesize 1 Year t/c Capesize Bulker 127K 150K Average Values, 2004-2013 Zap!! +120% -30% -90% -60% +30% +60% +90% 0 -120% Depression Recession Soft Firm Boom Bonanza -56% +120% -30% -90% -60% +30% +60% +90% 0 -120% Depression Recession Soft Firm Boom Bonanza -41% Zap!! Licensed to Shanghai Maritime University. Distribution is restricted; please remember to acknowledge the source. http://www.clarksons.net 15/09/2014 08:45:39 36122 Licensed to Shanghai Maritime University. Distribution is restricted; please remember to acknowledge the source. http://www.clarksons.net 15/09/2014 08:45:39 36122