正在加载图片...
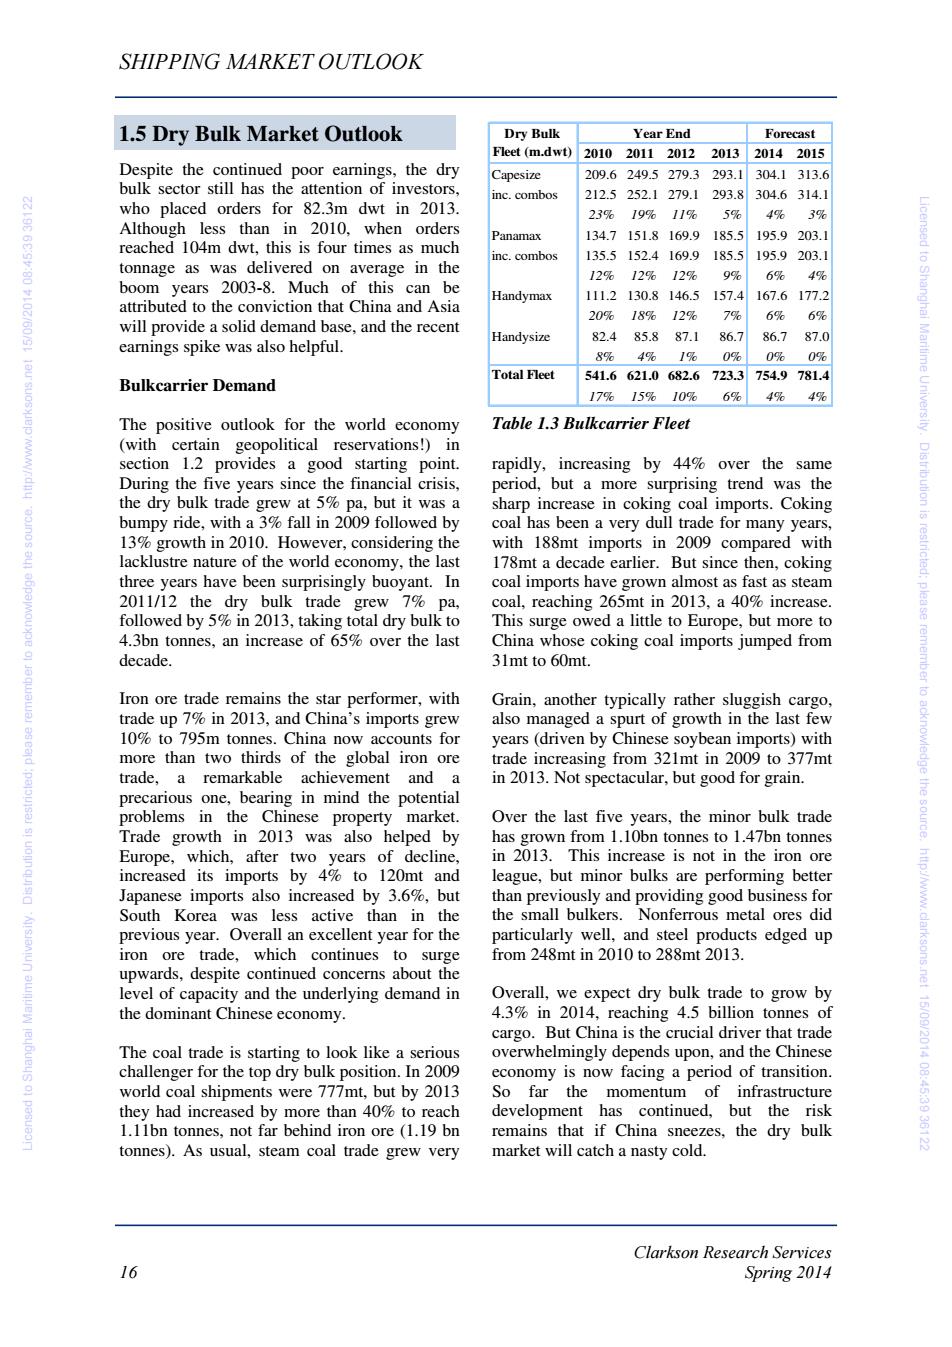
SHIPPING MARKET OUTLOOK 1.5 Dry Bulk Market Outlook Dry Bulk Year End Forecast Fleet (m.dwt) 201020112012201320142015 Despite the continued poor earnings,the dry Capesize 209.6249.5279.3 293.1 304.1313.6 bulk sector still has the attention of investors. inc.combos 212.5252.1279.1 293.8 304.6314.1 who placed orders for 82.3m dwt in 2013. 23% 19% 11% 5% 4% 3% Although less than in 2010,when orders Panamax 134.7151.8169.9185.5 195.9203.1 reached 104m dwt,this is four times as much inc.combos 135.5152.4169.9 185.5 195.9203.1 tonnage as was delivered on average in the 12%12%12% 9% 6% 4% boom years 2003-8.Much of this can be #10216031 Handymax 111.2130.8146.5 157.4 167.6177.2 attributed to the conviction that China and Asia 20% 18%12% 7% 6% 6% will provide a solid demand base,and the recent Handysize 82.485.887.186.7 87.0 earnings spike was also helpful. 86.7 8% 4% 1% 0% 0% 0% Total Fleet 541.6621.0682.6723.3 754.9781.4 Bulkcarrier Demand 17% 15%10% 6% 4% 4% The positive outlook for the world economy Table 1.3 Bulkcarrier Fleet (with certain geopolitical reservations!)in section 1.2 provides a good starting point. rapidly,increasing by 44%over the same During the five years since the financial crisis, period,but a more surprising trend was the the dry bulk trade grew at 5%pa,but it was a sharp increase in coking coal imports.Coking Dis tribution is bumpy ride,with a 3%fall in 2009 followed by coal has been a very dull trade for many years, 13%growth in 2010.However,considering the with 188mt imports in 2009 compared with lacklustre nature of the world economy,the last 178mt a decade earlier. But since then,coking three years have been surprisingly buoyant.In coal imports have grown almost as fast as steam 2011/12 the dry bulk trade grew 7%pa, coal,reaching 265mt in 2013,a 40%increase. plea followed by 5%in 2013,taking total dry bulk to This surge owed a little to Europe,but more to 4.3bn tonnes,an increase of 65%over the last China whose coking coal imports jumped from decade. 31mt to 60mt. remember to Iron ore trade remains the star performer,with Grain,another typically rather sluggish cargo, trade up 7%in 2013,and China's imports grew also managed a spurt of growth in the last few 10%to 795m tonnes.China now accounts for years (driven by Chinese soybean imports)with more than two thirds of the global iron ore trade increasing from 321mt in 2009 to 377mt acknowledge trade,a remarkable achievement and a in 2013.Not spectacular,but good for grain. precarious one,bearing in mind the potential problems in the Chinese property market. Over the last five years,the minor bulk trade the sourde. Trade growth in 2013 was also helped by has grown from 1.10bn tonnes to 1.47bn tonnes Europe,which,after two years of decline, in 2013.This increase is not in the iron ore increased its imports by 4%to 120mt and league,but minor bulks are performing better Japanese imports also increased by 3.6%,but than previously and providing good business for http://ww. South Korea was less active than in the the small bulkers.Nonferrous metal ores did previous year.Overall an excellent year for the particularly well,and steel products edged up iron ore trade,which continues to surge from 248mt in 2010 to 288mt 2013. upwards,despite continued concerns about the level of capacity and the underlying demand in Overall,we expect dry bulk trade to grow by the dominant Chinese economy. 4.3%in 2014,reaching 4.5 billion tonnes of cargo.But China is the crucial driver that trade The coal trade is starting to look like a serious overwhelmingly depends upon,and the Chinese challenger for the top dry bulk position.In 2009 economy is now facing a period of transition. world coal shipments were 777mt,but by 2013 So far the momentum of infrastructure .2218303:54:80410299051ci they had increased by more than 40%to reach development has continued,but the risk 1.11bn tonnes,not far behind iron ore (1.19 bn remains that if China sneezes,the dry bulk tonnes).As usual,steam coal trade grew very market will catch a nasty cold. Clarkson Research Services 16 Spring 2014Clarkson Research Services 16 Spring 2014 SHIPPING MARKET OUTLOOK Despite the continued poor earnings, the dry bulk sector still has the attention of investors, who placed orders for 82.3m dwt in 2013. Although less than in 2010, when orders reached 104m dwt, this is four times as much tonnage as was delivered on average in the boom years 2003-8. Much of this can be attributed to the conviction that China and Asia will provide a solid demand base, and the recent earnings spike was also helpful. Bulkcarrier Demand The positive outlook for the world economy (with certain geopolitical reservations!) in section 1.2 provides a good starting point. During the five years since the financial crisis, the dry bulk trade grew at 5% pa, but it was a bumpy ride, with a 3% fall in 2009 followed by 13% growth in 2010. However, considering the lacklustre nature of the world economy, the last three years have been surprisingly buoyant. In 2011/12 the dry bulk trade grew 7% pa, followed by 5% in 2013, taking total dry bulk to 4.3bn tonnes, an increase of 65% over the last decade. Iron ore trade remains the star performer, with trade up 7% in 2013, and China’s imports grew 10% to 795m tonnes. China now accounts for more than two thirds of the global iron ore trade, a remarkable achievement and a precarious one, bearing in mind the potential problems in the Chinese property market. Trade growth in 2013 was also helped by Europe, which, after two years of decline, increased its imports by 4% to 120mt and Japanese imports also increased by 3.6%, but South Korea was less active than in the previous year. Overall an excellent year for the iron ore trade, which continues to surge upwards, despite continued concerns about the level of capacity and the underlying demand in the dominant Chinese economy. The coal trade is starting to look like a serious challenger for the top dry bulk position. In 2009 world coal shipments were 777mt, but by 2013 they had increased by more than 40% to reach 1.11bn tonnes, not far behind iron ore (1.19 bn tonnes). As usual, steam coal trade grew very rapidly, increasing by 44% over the same period, but a more surprising trend was the sharp increase in coking coal imports. Coking coal has been a very dull trade for many years, with 188mt imports in 2009 compared with 178mt a decade earlier. But since then, coking coal imports have grown almost as fast as steam coal, reaching 265mt in 2013, a 40% increase. This surge owed a little to Europe, but more to China whose coking coal imports jumped from 31mt to 60mt. Grain, another typically rather sluggish cargo, also managed a spurt of growth in the last few years (driven by Chinese soybean imports) with trade increasing from 321mt in 2009 to 377mt in 2013. Not spectacular, but good for grain. Over the last five years, the minor bulk trade has grown from 1.10bn tonnes to 1.47bn tonnes in 2013. This increase is not in the iron ore league, but minor bulks are performing better than previously and providing good business for the small bulkers. Nonferrous metal ores did particularly well, and steel products edged up from 248mt in 2010 to 288mt 2013. Overall, we expect dry bulk trade to grow by 4.3% in 2014, reaching 4.5 billion tonnes of cargo. But China is the crucial driver that trade overwhelmingly depends upon, and the Chinese economy is now facing a period of transition. So far the momentum of infrastructure development has continued, but the risk remains that if China sneezes, the dry bulk market will catch a nasty cold. 1.5 Dry Bulk Market Outlook Table 1.3 Bulkcarrier Fleet Year End Forecast 2010 2011 2012 2013 2014 2015 Capesize 209.6 249.5 279.3 293.1 304.1 313.6 inc. combos 212.5 252.1 279.1 293.8 304.6 314.1 23% 19% 11% 5% 4% 3% Panamax 134.7 151.8 169.9 185.5 195.9 203.1 inc. combos 135.5 152.4 169.9 185.5 195.9 203.1 12% 12% 12% 9% 6% 4% Handymax 111.2 130.8 146.5 157.4 167.6 177.2 20% 18% 12% 7% 6% 6% Handysize 82.4 85.8 87.1 86.7 86.7 87.0 8% 4% 1% 0% 0% 0% 541.6 621.0 682.6 723.3 754.9 781.4 17% 15% 10% 6% 4% 4% Dry Bulk Fleet (m.dwt) Total Fleet Licensed to Shanghai Maritime University. Distribution is restricted; please remember to acknowledge the source. http://www.clarksons.net 15/09/2014 08:45:39 36122 Licensed to Shanghai Maritime University. Distribution is restricted; please remember to acknowledge the source. http://www.clarksons.net 15/09/2014 08:45:39 36122