正在加载图片...
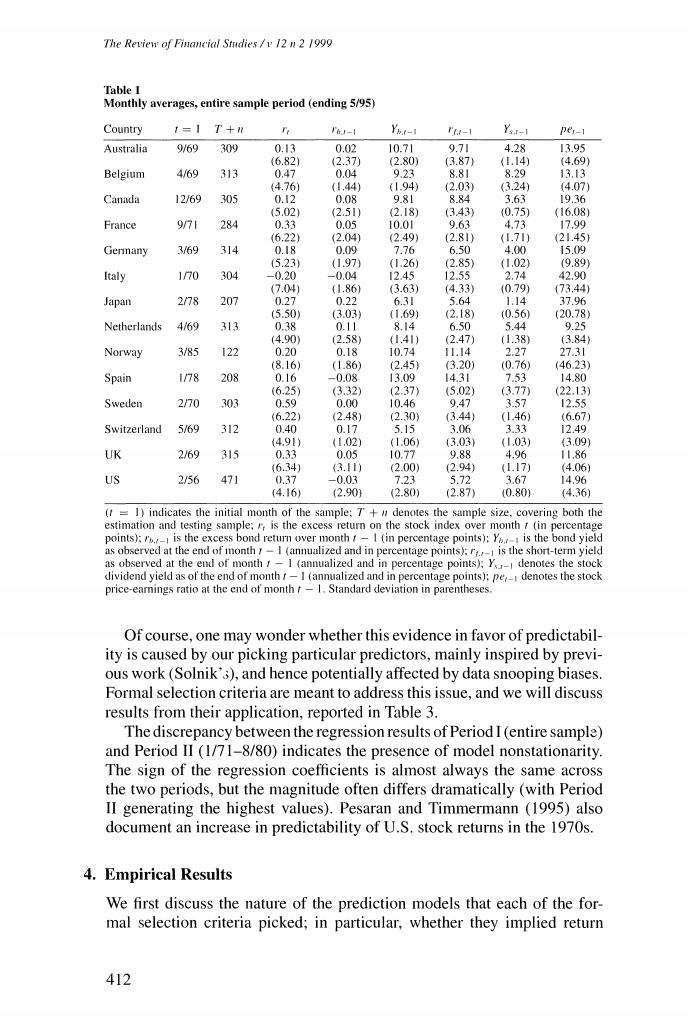
The Review of Financial Studies /v 12 n 2 1999 Table I Monthly averages,entire sample period (ending 5/95) Country 1=1 T+ I6J-1 Yh.t-1 -1 YsI-I per-1 Australia 9/69 309 0.13 0.02 10.71 9.71 4.28 13.95 (6.82) (2.37 (2.80) (3.87) (1.14) (4.69) Belgium 4/69 313 0.47 0.04 9.23 8.81 8.29 1313 (4.76) (1.44) (1.94) 2.03) (3.24) (4.07) Canada 12/69 305 0.I2 0.08 9.81 8.84 3.63 19.36 (5.02) (2.51) (2.18) (3.43) 0.75) (16.08) France 971 284 0.33 0.05 10.01 9.63 4.73 17.99 (6.22) (2.04) (2.49) (2.81) (1.71) (21.45) Germany 3/69 314 0.18 0.09 7.76 6.50 4.00 15.09 (5.23) (1.97) (1.26) (2.85) (1.02) (9.89) Italy 170 304 -0.20 -0.04 12.45 12.55 2.74 42.90 (7.04 (1.86) (3.63) (4.33) (0.79) (73.44) Japan 2/78 207 0.27 0.22 6.31 5.64 1.14 37.96 (5.50) (3.03 (1.69) (2.18) (0.56 (20.78) Netherlands 4/69 313 0.38 0.11 8.14 6.50 5.44 9.25 14.90 (2.58) (1.41) (2.47) (1.38) (3.84 Norway 3/85 122 0.20 0.18 10.74 11.14 2.27 27.31 (8.16) (1.86) (2.45 (3.20) (0.76) (46.23) Spain 1/78 208 0.16 -0.08 13.09 14.31 7.53 14.80 (6.25 (3.32) (2.37) (5.02) (3.77 (22.13) Sweden 270 303 0.59 0.00 10.46 9.47 3.57 12.55 (6.22) (2.48) (2.30) (3.44) (1.46) (6.67) Switzerland 5/69 312 0.40 0.17 5.15 3.06 3.33 12.49 (4.91) 41.02) (1.06) (3.03) (1.03) (3.09) UK 2/69 315 0.33 0.05 10.77 988 4.96 11.86 (6.34) 3.11) (2.00 (2.94) (1.17) (4.06) US 2/56 471 0.37 -0.03 7.23 5.72 3.67 14.96 (4.16) (2.90) (2.80) (2.87) (0.80) (4.36) (t=1)indicates the initial month of the sample:7+#denotes the sample size,covering both the estimation and testing sample:is the excess return on the stock index over month t(in percentage points):is the excess bond return over month t-I (in percentage points);Y is the bond yield as observed at the end of month /-I (annualized and in percentage points);r,is the short-term yield as observed at the end of month r-I (annualized and in percentage points);Y denotes the stock dividend yield as of the end of month f-I (annualized and in percentage points):pe,_denotes the stock price-earnings ratio at the end of month t-1.Standard deviation in parentheses Of course,one may wonder whether this evidence in favor of predictabil- ity is caused by our picking particular predictors,mainly inspired by previ- ous work (Solnik'3),and hence potentially affected by data snooping biases. Formal selection criteria are meant to address this issue,and we will discuss results from their application,reported in Table 3. The discrepancy between the regression results of Period I(entire sample) and Period II (1/71-8/80)indicates the presence of model nonstationarity. The sign of the regression coefficients is almost always the same across the two periods,but the magnitude often differs dramatically (with Period II generating the highest values).Pesaran and Timmermann (1995)also document an increase in predictability of U.S.stock returns in the 1970s. 4.Empirical Results We first discuss the nature of the prediction models that each of the for- mal selection criteria picked;in particular,whether they implied return 412