正在加载图片...
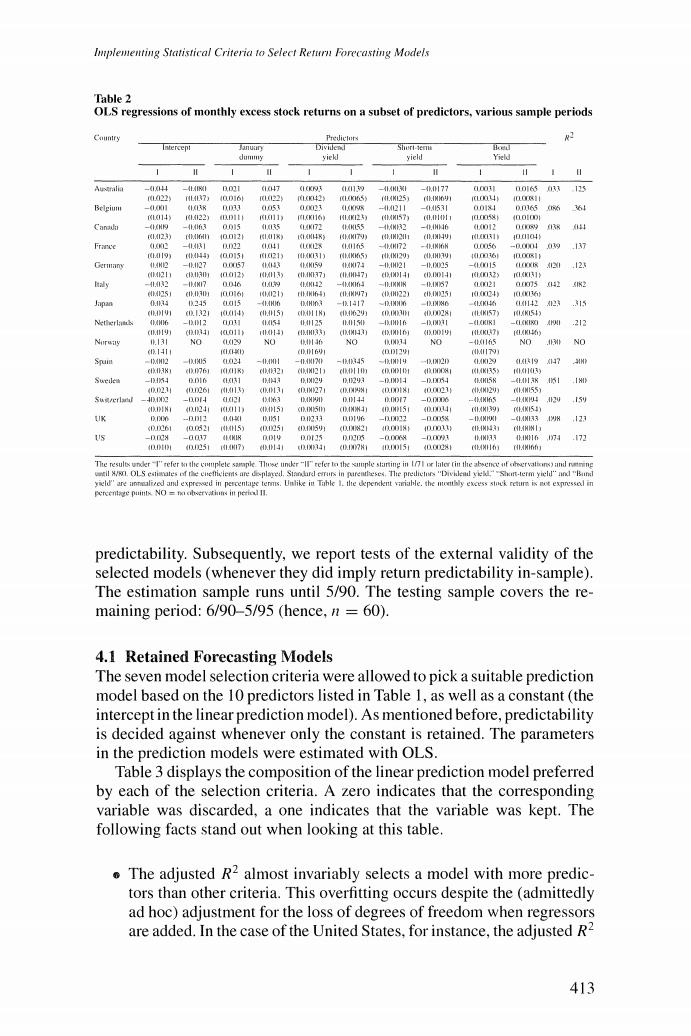
Implementing Statistical Criteria to Select Return Forecasting Models Table 2 OLS regressions of monthly excess stock returns on a subset of predictors,various sample periods Country Predicturs Intercept Januiry Diviulenl Shurt-em k dummy yiekl yield Yield 1 1 1 -4 147 10139 - -,177 006533125 22 L.7) 40016 22 C42 f5) NL4K125 (INKO9I CLOU 01I Belgium -01 3锅 f115 4 I线 -41211 -01531 0014 0n1656 364 0145 1012231D111 111 116h I1联I25) 非NI57h cLUIOL jo5) n010DE -(H9 -06 005 05 1m12 0f9 1,23) ( 0012 114界影 KHAKI79) .2 00104 Frarce 0正 -431 2 041 L属 5 -4MI72 -一.N省N 056 -000川a9 137 19) M44)0D15 1213 A131) AN65) NkINI203 ,H3 00m6 00s11 414N2 -40127 057 3 作N1g 4N171 4M21 -4北15 -1m115 候 125 2 3 400129 13 7) 082> y 儿2 -.w7 40 (1AKH42 -KI3 -I.IKHIR -.1m87 L21 0[35 2 41K2 GM251 c030 h 101213 rltINI64) (NM7] (H22) .m251 0004) 1016 Japan 0.3 245 a015 -.H角 DHI3 -.1417 一.IMA角 一Mw6 46 11142125 315 (. .1.321 1414 5 e4场h CD 133II 40078 NAKI54) 5 125 .1 212 (.I (3打4011 l0I+1 GMIKI351 值.MM口3)HI1) D19判 RLXKL7 K场) .131 NO 29 NO .13折 NO 镇3H NO -4165 NO NO 141 B16小 0311i (MI179) Spamn -1X4M12 -B.M -.345 -.2 2 1159 H N 71 1(1X11K> 2 .N21 C11M51151 1 1w559 0015 Swedea -54 位6 31 ,IM29 D293 -位D11 -D54 .WL58 -1川粥 A51 INIX 40D271 i126 113 (DIN2271 位制 DmIXI 40n1 N54N101 NANI5S) 3 2 15到 CIDPIN1 2 111 KIINIW (米 .4N.9) UK D 000 -几I1 LXH1 11KSI D233 DD196 -1022 一 -INMKI -1MN33 界 123 0261 008211tH5) 0251 5明 (I821 4只)4非 001 C.W43 .A州微I与 你 -Dn0x -0017 4KIR 0川 DD115 D0005 -00M -n091 N31 IINIL6 ,7 172 4251 1AM7) . 3 yieldare inmlized and exprexd in percentage terms.Unlike in Tahle 1.thte depencknt viiable.the ntomthly excess stek retumm ix not expressedl in percentagte puints NO na olvervatiuns int peried 1l. predictability.Subsequently,we report tests of the external validity of the selected models(whenever they did imply return predictability in-sample). The estimation sample runs until 5/90.The testing sample covers the re- maining period:6/90-5/95 (hence,n =60). 4.1 Retained Forecasting Models The seven model selection criteria were allowed to pick a suitable prediction model based on the 10 predictors listed in Table 1,as well as a constant(the intercept in the linear prediction model).As mentioned before,predictability is decided against whenever only the constant is retained.The parameters in the prediction models were estimated with OLS. Table 3 displays the composition of the linear prediction model preferred by each of the selection criteria.A zero indicates that the corresponding variable was discarded,a one indicates that the variable was kept.The following facts stand out when looking at this table. The adjusted R2 almost invariably selects a model with more predic- tors than other criteria.This overfitting occurs despite the (admittedly ad hoc)adjustment for the loss of degrees of freedom when regressors are added.In the case of the United States,for instance,the adjusted R2 413